
 Submit Manuscript
Research Article | Open Access
Specific Gravity-Normalized Urinary Nucleic-Acid Signal Measured by UV Spectrophotometry as a Feasibility Marker for Male Urothelial Bladder Carcinoma Triage: A Prospective Case–Control Study
Neeraj Gupta1, 3, Shikhar Agarwal2, Aarti Solanki3
1Department of Biochemistry, Graphic Era Institute of Medical Sciences, Graphic Era Deemed to be University, Dehradun, 248008, India.
2Department of Urology, Himalayan Institute of Medical Science, Swami Rama Himalayan University, Dehradun, 248016, India.
3Department of Biochemistry, Himalayan Institute of Medical Sciences, Swami Rama Himalayan University, Dehradun, 248016, India.
Correspondence: Neeraj Gupta (Department of Biochemistry, Graphic Era Institute of Medical Sciences, Graphic Era Deemed to be University, Dehradun, 248008, India; Email: neerajgupta.geims@geu.ac.in).
Annals of Urologic Oncology 2026, 9: 5. https://doi.org/10.32948/auo.2026.09.10
Received: 23 Jul 2026 | Accepted: 30 Aug 2026 | Published online: 11 Oct 2026
Methods This prospective diagnostic accuracy study, conducted at a tertiary care center in North India (September 2023–August 2025), included 127 histopathologically confirmed male UCB patients and 262 healthy male controls. Urinary total nucleic acid concentrations were measured by UV spectrophotometry at 260 nm and normalized to urine specific gravity. Logistic regression incorporating age and log-transformed SGN-uTNA predicted cancer probability. Diagnostic performance was assessed using ROC analysis and four-fold cross-validation.
Results SGN-uTNA levels were significantly higher in cases than controls (p=4.49×10-⁴; Cohen's d = 0.38). The logistic regression model achieved an AUC of 0.744. Age was the stronger predictor, and adding logSGN-uTNA to an age-only model did not significantly improve prediction (likelihood-ratio χ² = 1.91, p = 0.167). At a probability threshold of 0.25, mean sensitivity was 0.83 ± 0.05, specificity 0.47 ± 0.03, and negative predictive value 0.85. A negative result reduced the pre-test probability from 33% to 15%. Limitations included male-only participation, single-center design, and limited predictive contribution of logSGN-uTNA beyond age.
Conclusion SGN-uTNA demonstrated moderate discrimination and useful sensitivity but limited incremental value beyond age. It warrants further evaluation as a low-cost triage or rule-out aid rather than a stand-alone screening test. Multicentric validation and integration with tumor-specific molecular assays are needed.
Key words urinary total nucleic acid, urinary bladder urothelial carcinoma, uv spectroscopy, specific gravity, non-invasive biomarker
Study design: We conducted a prospective diagnostic accuracy study with case–control sampling to evaluate how well urinary total nucleic acid levels (measured at 260 nm) can detect bladder cancer. Data collection was planned in advance, and as patients were enrolled, their urine samples were tested and the results were compared with the histopathological diagnosis from tumour biopsy, which served as the gold standard. The study period was from September, 2023 to August, 2025.
Eligibility criteria: During the study period (September, 2023 to August, 2025), two groups of participants were enrolled.
Control group: Naturally voided urine samples were collected from 264 healthy male volunteers (mean age: 47.3 years; range: 19–87 years) working in various departments of Swami Rama Himalayan University, Dehradun, Uttarakhand, India, postal code 248016. The cohort also included students enrolled in different academic programs of the university, such as medical and allied health sciences courses. Two outliers with values exceeding three standard deviations from the mean were excluded. The final analysis therefore included 262 subjects. The volunteers were screened for urinary/urological problems and only those without such problems were included in the study.
Patient group: A total of 167 male patients suspected of having bladder cancer, based on positive findings from ultrasonography and/or computerized tomography (CT), were recruited consecutively from the Department of Urology, Himalayan Institute of Medical Sciences (HIMS), Jolly Grant, Dehradun. Histopathological confirmation was obtained for all patients. Thirty-nine patients were excluded for various reasons, including alternative diagnoses on histopathology (e.g., renal cell carcinoma, squamous cell carcinoma, adenocarcinoma), non-completion of treatment due to death during follow-up, loss to follow-up (patients not operated or who sought treatment elsewhere and became untraceable), and duplicate entries (two patients recruited twice). In addition, one outlier with values exceeding three standard deviations from the mean was excluded. The final analysis included 127 patients (mean age: 57.9 years; range: 22–92 years).
Inclusion criteria for patients were: Patients were eligible if they:
Were newly diagnosed with suspected urinary bladder carcinoma,
Had no visible haematuria at the time of urine collection (although haematuria could have been present intermittently before), and
Had not received any prior medical intervention or treatment for bladder cancer.
Final inclusion in the study was confirmed only after surgery, when the histopathological report of the resected tissue verified the diagnosis of urinary bladder carcinoma. Patients without histopathological confirmation were excluded from the analysis.
Exclusion criteria for patients were:
History of prior treatment, such as Bacillus Calmette–Guérin (BCG) therapy or any other anti-cancer treatment.
Diagnosis of other malignancies (e.g., prostate or testicular cancer).
Identifying eligible participants: Patients were identified when they presented to the Department of Urology at HIMS, between September 2023 and August 2025, with suspicion of bladder cancer based on positive ultrasound and/or CT findings. At the time of presentation, we applied our predefined inclusion and exclusion criteria to determine eligibility. Patients meeting the initial criteria had urine samples collected during haematuria free episodes. Thereafter, patients proceeded to surgery—only those whose postoperative histopathological reports confirmed bladder carcinoma were included in the final analysis.
Setting, location, and dates: The study was conducted at the Himalayan Institute of Medical Sciences, Himalayan Hospital, Jolly Grant, Dehradun, Uttarakhand, India, postal code 248016.
Controls: Healthy male volunteers were recruited from across various departments of the Himalayan hospital and HIMS, as well as from healthy relatives accompanying patients.
All participants (patients and controls) were enrolled only after providing written informed consent.
Recruitment and data collection took place between 19th September 2023 and 30 August 2025.
Participant recruitment. Eligible patients were enrolled in a consecutive series: all patients presenting to the Department of Urology, HIMS during the study period (19th September, 2023 to 30th August, 2025) who met the inclusion and exclusion criteria were included in the study. The study protocol was approved by the Research and Ethics Committee of HIMS, and written informed consent was obtained from all participants.
Test methods
Index test: The test under evaluation (index test) in this study is the measurement of urine total nucleic acid concentration (uTNA) in patient or control urine samples, using spectrophotometric analysis as follows:
Pre-analytical phase
A single random urine sample was collected from each participant (healthy control or suspected bladder cancer patient), ensuring that all samples were free from visible haematuria at the time of collection; microscopic haematuria was not assessed.
Samples were collected in 50 ml sterile, leak-proof containers (Product code: AUC-03S; Astra Bioscience Ltd., Kerala, India).
Samples were immediately stored at –20°C without addition of any preservative, to avoid chemical interference.
The samples had been through one thaw–freeze cycle before analysis; no prolonged delays or additional freeze-thaw cycles beyond this.
Analytical phase
Spectrophotometric measurement
Urine samples are diluted 1:200 in double-distilled water.
A double-beam UV spectrophotometer (Systronics AU- 2704 X Flashing Xenon Lamp Spectrophotometer, RRID: SCR_027560) is used to measure absorbance at 260 nm. Double-distilled water serves as the blank [10].
As absorbance at 260 nm captures both DNA and RNA, total nucleic acid concentration is calculated via the formula: Absorbance at 260 nm × 50 μg/ml × dilution factor (i.e. 200) [10]. The UV260 method therefore provides an estimate of total nucleic-acid signal and does not distinguish DNA from RNA or tumour-derived nucleic acids from nucleic acids originating from normal urinary tract cells or other cellular sources.
Each sample is assayed in duplicate to ensure measurement precision.
Densitometric normalization
To account for variations in hydration status and time since last urination, nucleic acid concentrations were normalized using urine specific gravity.
USG was selected over creatinine-based correction, as previous studies have shown that creatinine normalization can be affected by diet, muscle mass, and comorbid conditions, whereas USG reflects a bulk property of the specimen and is more stable [13].
Normalization was performed according to the protocol described by [Burton et al. ,11] .
Final uTNA values used in statistical analyses were expressed as mg/ml normalized to USG.
Post-analytical phase
Outliers are identified; for example, values exceeding three standard deviations from the mean are excluded.
Reference standard rational: Histopathological examination of biopsy or surgical specimens was chosen as the reference standard because it provides definitive diagnosis of bladder cancer through direct tissue evaluation. Unlike imaging or cytology, which may yield false positives or negatives, histopathology is widely accepted in clinical practice as the gold standard, offering the highest diagnostic certainty and guiding patient management [14].
Index test cut-offs and rationale: The probability of bladder cancer was estimated for each participant using logistic regression with age and log-transformed urine total nucleic acid concentration as predictors. A probability threshold of 0.25 was selected: individuals with values ≥0.25 were classified as test-positive, and those <0.25 as test-negative. This cut-off was chosen because it provided the best performance as a rule-out tool in our validation analysis, achieving high sensitivity and a low negative likelihood ratio. Thus, a negative result strongly reduces the probability of bladder cancer and may help safely avoid unnecessary invasive investigations, whereas a positive result serves as a signal for additional confirmatory diagnostic evaluation.
Information available to performers or readers of the index test and reference standard assessors: In our study, the same individual performed and interpreted the index test. This person had access to participants’ clinical information, including signs and symptoms, but was blinded to the results of the reference standard test. The assessors of the reference standard test, in turn, were blinded to the index test results. Thus, both the index test reader and the reference test assessor were masked to each other’s findings. Only the principal investigator had access to both sets of results. This information is reported to enable readers to assess the potential for bias, in accordance with STARD recommendations [15].
Analysis
Analysis methods: All data analysis were performed using JASP (version 0.19.3, RRID: SCR_015823) [16] and Jamovi software (version 2.6.26.0, RRID: SCR_016142) [17]. Logistic regression was used to estimate the probability of bladder cancer for each participant, with age and the natural log-transformed specific gravity–normalized urinary total nucleic acid concentration (mg/mL) as predictors. Histopathological diagnosis served as the reference standard. Internal validity was assessed using four-fold cross-validation. The dataset was randomly divided into four equal parts; in each iteration, three folds were used to train the logistic model and the remaining fold was used for validation. To determine an appropriate classification threshold, we evaluated model performance across a range of probability cut-offs in each fold. Predicted probabilities were obtained from the logistic equation, converted to logit, odds, and probability, and then classified using the selected threshold. A probability cut-off of 0.25 was chosen because it consistently provided the best rule-out performance, achieving high sensitivity and a low negative likelihood ratio. This threshold corresponds to a logit value of ln(0.25/0.75) ≈ −1.0987. Participants with predicted probabilities ≥ 0.25 were classified as test-positive, and those < 0.25 as test-negative. Diagnostic performance was then evaluated against the histopathological standard using 2×2 contingency tables. Sensitivity, specificity, predictive values, accuracy, and likelihood ratios were calculated with 95% confidence intervals.
Indeterminate results: There were no indeterminate or non-interpretable results for either the index test or the reference standard. We included only histopathologically confirmed cases of urothelial carcinoma (high- or low-grade, with or without deep muscle invasion) and excluded other diagnoses (e.g., mucin-producing adenocarcinoma, squamous cell carcinoma, or no tumour). All included cases and controls yielded valid index test results. One urothelial carcinoma case and two controls were excluded because their values were more than three standard deviations from the mean as statistical outliers. These exclusions were based on outlier criteria rather than indeterminate test performance.
Variability: Variability analyses were partially explored through predefined subgroup analyses based on tumour characteristics. Specifically, stratified analyses were performed according to tumour grade (low-grade vs. high-grade urothelial carcinoma) and deep muscle infiltration status (muscle-free, muscle-infiltrated, and indeterminate groups), as presented in Figure 3 and Figure 4. These analyses were undertaken to evaluate whether SGN-uTNA concentrations differed across clinically relevant pathological subgroups and to assess the marker’s performance in early-stage disease. The study population was restricted to male participants as predefined before the start of the project; therefore, subgroup analyses by sex were not applicable. Formal stratified analyses by age categories were not performed, although age was incorporated as a continuous covariate in the logistic regression model. All index tests were conducted by a single trained research assistant to minimize inter-operator variability.
Sample size and justification: Based on preliminary data (controls, n = 156: mean 3.69 mg/ml, SD 1.13; cases, n = 34: mean 5.23 mg/ml, SD 3.44), the observed mean difference was 1.54 mg/ml. The variability in urinary bladder cancer cases (range 19.57 mg/ml, SD 3.44) was substantially higher than in controls (range 5.89 mg/ml, SD 1.13). Using the Open-Source Epidemiologic Statistics for Public Health (OpenEpi) calculator [18], the minimum required sample size to detect this mean difference with 95% power at α = 0.05 was estimated at 36 subjects per group (72 total). However, in view of the greater variability observed in cases, the need for precise estimation of diagnostic performance, and to allow for potential sample loss or exclusions, we recruited substantially larger numbers.
Control group. Naturally voided urine samples were collected from 264 healthy male volunteers (mean age 47.3 years; range 19–87 years) working in various departments of Swami Rama Himalayan University, Dehradun as well as students enrolled in different academic programs (medical and allied health sciences). Two outliers (>3 SD from the mean) were excluded, leaving 262 controls for the final analysis.
Altogether, the study included 127 cases and 262 controls, far exceeding the minimal requirement of 72 total participants. This larger sample size provided greater statistical power, narrower confidence intervals, and enhanced generalizability of the findings.
Participants flow diagram: During the study period (September 2023 to August 2025), two groups of participants were enrolled. Cases (n = 167) were recruited consecutively from the Department of Urology, Himalayan Institute of Medical Sciences (HIMS), Jolly Grant, Dehradun. Controls (n = 264) were recruited from various departments and academic programs of the Swami Rama Himalayan University. Among the cases, 39 were excluded for reasons including alternative histopathological diagnoses (renal cell carcinoma, adenocarcinoma, squamous cell carcinoma, benign prostatic hyperplasia, chronic inflammation, or no tumour), death before surgery, being unfit for surgery, loss to follow-up, duplicate entries, or insufficient tissue for evaluation. One additional outlier (>3 SD from the mean) was also excluded. The final analytic cohort included 127 patients with histopathologically confirmed urothelial carcinoma. Of these, 83 had high-grade tumours (25 free of deep muscle infiltration, 50 with deep muscle infiltration, 8 with status not defined) and 44 had low-grade tumours (39 free of deep muscle infiltration, 1 with deep muscle infiltration, 4 with status not defined). The final control group comprised 262 healthy male volunteers after exclusion of two outliers. See Figure 1.
Baseline characteristics: The study was conducted at the Himalayan Institute of Medical Sciences, Swami Rama Himalayan University, Jolly Grant, Dehradun, Uttarakhand, India, and participants represented the North Indian male population of Uttarakhand. A total of 127 male patients with histopathologically confirmed urothelial carcinoma of the bladder were included. Only treatment-naïve patients were recruited; individuals with prior interventions (including BCG instillation or any form of anti-cancer therapy) were excluded. Patients with haematuria, prostate cancer, or testicular cancer were also not eligible. Baseline characteristics of cases and controls are presented in Table 1, which provides descriptive statistics for age, specific gravity normalized urinary total nucleic acid concentrations (SGN-uTNA, mg/mL), and their log10-transformed values. The median age of cases was 58 years (range 22 – 92), compared with 48 years (range 19 – 87) in controls. The distributions were roughly symmetric with few extreme values, consistent with near-normality.
Participants with and without the target condition: Among the 127 patients with histopathologically confirmed urothelial carcinoma of the bladder, 83 were classified as high grade and 44 as low grade. Assessment of deep muscle involvement showed that, in the high-grade group, 25 were free of infiltration, 50 had infiltration, and in 8 cases the status was not defined. In the low-grade group, 39 were free of deep muscle infiltration, 1 had infiltration, and 4 were not defined. The control group (n = 262) consisted of healthy male volunteers without any urological complaints or history of urological disease Figure 1. These controls were recruited from university staff and students. While they may have had unrelated metabolic conditions typical of the general population (such as diabetes or hypertension), none had active or prior urological pathology.
Time interval: Urine for the index test was collected at the patient’s first presentation to the urology outpatient department, immediately after confirming eligibility and obtaining consent, and always before any diagnostic or therapeutic intervention. Following urine collection, patients underwent the routine clinical pathway, which included ultrasonography and CT imaging, followed by surgical resection. Histopathological examination of the resected tissue served as the reference standard. The interval between urine collection and histopathological confirmation generally ranged from a few days to several weeks (approximately 4–47 days), depending on factors such as patient compliance, operating theatre scheduling, and clinician availability etc.
Test results
Index test results: Distributions of index test results were explored visually using Q-Q plots for each variable Figure 2. Age was approximately normally distributed in both groups as seen by Q-Q plot Figure 2-A. In contrast, the SGN-uTNA concentrations (mg/mL) showed deviation from normal distribution, see Q-Q plot Figure 2-B, the data were log10-transformed, which produced a distribution closer to normality as evident from the Q-Q plot Figure 2-C. After log10-transformation, the logSGN-uTNA data showed a much more symmetric distribution and Q-Q plots demonstrated a closer fit to the line of normality. Because the log10-transformation of SGN-uTNA data produced data closer to a normal distribution-fulfilling assumptions required for parametric tests-all subsequent inferential analyses (t-tests, scatter plots, logistic regression) were performed on the log10-transformed SGN-uTNA values. The raw values of SGN-uTNA are reported alongside the transformed values for transparency. Consistent with the guidelines of [Assel et al. ,19], which caution against using formal normality tests to dictate the choice of statistical method (Section 3.9: Avoid using statistical tests to determine the type of analysis to be conducted), we did not rely on hypothesis testing for normality. Because no real dataset is perfectly normal, we assessed distributional shape visually using Q–Q plots rather than applying formal normality tests.
Scatter plot: We used scatter plots to visualize the relationship between age and log₁₀-transformed SGN-uTNA concentrations and to examine how these values vary when cases are stratified by tumour grade (low vs. high) or deep-muscle invasion status (muscle-free vs. muscle-infiltrated) (Figure 3). These plots enable a direct visual appraisal of age-related trends and group differences. Figure 3-A shows the relationship between age and logSGN-uTNA in controls and cases. Across all ages, cases consistently exhibit higher logSGN-uTNA values than controls, indicating that elevated urinary total nucleic acid levels are not confined to any specific age group. Figure 3-B compares logSGN-uTNA levels when cases are classified by tumour grade. Notably, low-grade tumours display higher mean logSGN-uTNA concentrations than high-grade tumours, suggesting that nucleic-acid release is already prominent in early, less aggressive disease. Figure 3-C stratifies cases by deep-muscle invasion status. Here, deep-muscle-infiltrated tumours show distinctly higher logSGN-uTNA levels than both muscle-free cases and controls, underscoring the marker’s ability to identify advanced disease. A grey “indeterminate” subgroup for deep-muscle status also demonstrates relatively high logSGN-uTNA concentrations. Figure 3-D isolates tumours that are simultaneously low grade and muscle-free—the earliest stage detectable in this study. Even within this very early subset, logSGN-uTNA levels remain significantly higher than in controls, highlighting the marker’s potential for detecting incipient bladder cancer before progression. Taken together, these scatter plots demonstrate that logSGN-uTNA effectively distinguishes controls from a wide spectrum of pathological subgroups, supporting its value for both early detection and stage differentiation of bladder cancer.
Descriptive Statistics of the Index Test: Index test results are presented in Table 1 and Figure 2 (Box plots), which provides specific gravity normalized urinary total nucleic acid concentrations (SGN-uTNA, mg/mL), and their Log10-transformed values (logSGN-uTNA). Among the 127 bladder-cancer cases, the mean specific-gravity–normalized urinary total nucleic acid (SGN-uTNA) concentration was 6.04 ± 3.55 mg/mL, with a median of 5.07 mg/mL (IQR 3.22). In the 262 controls, the mean was 4.93 ± 2.84 mg/mL, and the median was 4.15 mg/mL (IQR 2.27). After log₁₀ transformation, cases had a mean of 0.72 ± 0.22 and a median of 0.71 (IQR 0.27), whereas controls had a mean of 0.64 ± 0.20 and a median of 0.62 (IQR 0.23). The mean and median values were consistently higher in cases as compared to controls for both the raw and the logSGN-uTNA data.
Independent samples Student’s t-test: After establishing visual and descriptive differences in SGN-uTNA between cases and controls and across tumour subgroups, we proceeded to formally test these differences using independent samples Student’s t-test on log₁₀-transformed SGN-uTNA data. The purpose is whether logSGN-uTNA could discriminate cases from controls at progressively earlier stages of disease. Please see Figure 4 displaying the bar graph for mean of logSGN-uTNA concentrations with 95 % confidence intervals in cases and controls.
Figure 4-A – All cases vs controls: Index test could significantly detect bladder-cancer cases from healthy controls, with cases showing higher mean logSGN-uTNA concentrations (n = 127; (M = 0.72, SD = 0.22)) than controls (n = 262; M = 0.64, SD = 0.20), t(387) = 3.54, p = 4.49 × 10⁻⁴. Cohen’s d = 0.38) indicates a small but meaningful effect, establishing the assay’s overall diagnostic ability.
Figure 4-B – Low-grade tumours cases vs controls: To explore the test’s performance in earlier stage disease, we focused on the low-grade subgroup (n = 44). Here too, cases showed significantly higher logSGN-uTNA concentrations (n = 44; (M = 0.72, SD = 0.22)) than controls (n = 262; M = 0.64, SD = 0.20), t(304) = 2.34, p = 0.02. Cohen’s d = 0.38), indicates a small effect but can detect bladder cancer even at a histologically less aggressive, low-grade stage.
Figure 4-C – Deep-muscle-free tumours vs controls: To assess the test’s performance in earlier-stage disease, we focused on tumours without deep-muscle infiltration (n = 64). In this subgroup, logSGN-uTNA concentrations did not differ significantly in cases (n = 64; M = 0.68, SD = 0.20) and controls (n = 262; M = 0.64, SD = 0.20), t(324) = 1.47, p = 0.14. Cohen's d = 0.20). These findings indicate that, when disease stage is defined by deep-muscle infiltration, logSGN-uTNA alone may not reliably distinguish early, muscle-free tumours from non-cancer controls.
Figure 4-D –Deep-muscle–free and deep-muscle–indeterminate tumours versus controls: When the analysis was expanded to include both deep-muscle–free (n = 64) and deep-muscle–indeterminate cases (n = 12) (Figure 1), the difference again reached significance: cases (n = 76; M = 0.71, SD = 0.22) versus controls (n = 262; M = 0.64, SD = 0.20), t(336) = 2.64, p = 8.58 × 10⁻³, Cohen’s d = 0.34. Although the effect size remains small, this finding suggests that indeterminate lesions—likely representing the earliest stage of deep-muscle involvement—contribute to detectable biomarker elevation.
Figure 4-E – Low-grade along with deep-muscle-free tumours vs controls When we explored down further to the subset of low-grade tumours without deep-muscle infiltration the test no longer achieved statistical significance between cases (n = 39; (M = 0.68, SD = 0.20)) and controls (n = 262; M = 0.64, SD = 0.20), t(299) = 1.20, p = 0.23. Cohen’s d = 0.21). This suggests that, at this most limited disease stage, logSGN-uTNA concentrations alone may not reliably distinguish cases from controls.
Figure 4-F – Low-grade along with deep-muscle-free or deep-muscle-indeterminate tumours vs controls. However, when we expanded the analysis to include low-grade tumour with either deep-muscle-free (n = 39), or deep muscle indeterminate cases (n = 4), the difference again became significant cases (n =43; (M = 0.72, SD = 0.22)) vs controls (n = 262; M = 0.64, SD = 0.20), t(303) = 2.20, p = 0.03. Cohen’s d = 0.17). The effect is small but it indicates that the assay can capture early bladder cancer when histologically indeterminate lesions for deep muscle infiltration—likely representing the earliest detectable stage of deep muscle infiltration—are included. This sequential analysis from Panel A to F highlights the assay’s early-detection capability. It consistently differentiates all cases from controls and remains significant in low-grade disease, briefly loses discriminative power in the narrowest low-grade, deep-muscle-free subgroup, and regains significance when deep-muscle-indeterminate lesions—likely the earliest detectable stage of deep muscle infiltration—are incorporated.
Logistic regression analysis: A binomial logistic regression analysis was performed using logSGN-uTNA concentration and age as predictors of bladder cancer status (Yes/No). Both variables were entered simultaneously, as the log transformation normalized the SGN-uTNA distribution (see Table 2 and Table 3 for the details). The overall model was significant (χ²(2) = 60.9, p < .001), with age emerging as a strong independent predictor of cancer status (B = 0.068, SE = 0.011, p < .001, OR = 1.07, 95% CI [1.05–1.09]) (see Figure 5-A). Although the logSGN-uTNA variable showed a positive association with cancer status (B = 0.77, SE = 0.56, p = 0.168, OR = 2.15, 95% CI [0.72–6.41]), this trend did not reach statistical significance in the current dataset (see Figure 5-B). An odds ratio greater than one indicates a positive relationship with the outcome variable, suggesting that higher values of the predictor increase the odds of being a case, whereas an odds ratio below one implies a negative or protective effect. Thus, even though the association between logSGN-uTNA and cancer status was not statistically significant, its odds ratio of approximately 2.15 suggests a potentially meaningful positive trend—patients with elevated urinary logSGN-uTNA concentrations were roughly twice as likely to be classified as cases at the same age. The slope for age is steeper and statistically significant, indicating that age exerts a strong independent effect on cancer risk, while higher logSGN-uTNA concentrations also contribute positively to the predicted probability, though with a lesser, non-significant effect. To assess the incremental predictive value of logSGN-uTNA beyond age, an age-only logistic regression model was compared with the combined model incorporating both age and logSGN-uTNA. The age-only model achieved an AUC of 0.74, which remained unchanged at 0.74 after the addition of logSGN-uTNA. Addition of logSGN-uTNA resulted in only a small reduction in deviance from 432.29 to 430.39, and the nested likelihood-ratio comparison was not statistically significant (χ² = 1.91, df = 1, p = 0.167), indicating that logSGN-uTNA did not provide a statistically significant incremental improvement in model performance beyond age alone in the present dataset. The combined model’s receiver operating characteristic (ROC) curve yielded an AUC of 0.744, indicating good discrimination between cases and controls (see Figure 6-A). The optimal cut-off probability was determined using the Youden index, which identified a threshold of 0.34 (see Figure 6-B), corresponding to the point of maximum combined sensitivity and specificity. This threshold represents the point that maximized the combined sensitivity and specificity according to the Youden index. However, because the intended application of the assay was an initial triage/rule-out strategy, we subsequently evaluated lower probability thresholds during four-fold cross-validation, with greater emphasis on sensitivity and negative likelihood ratio.
Estimates of accuracy
Internal Four-Fold Cross-Validation: An internal four-fold cross-validation was conducted based on the logistic regression (LR) model (see Table 2 and Table 3 for model details). The objective of this procedure was twofold:
To assess internal reliability: verifying whether the model’s performance metrics remained consistent across the four iterations when each fold was sequentially used as the validation set. This ensured that no data were excluded from training or validation, thereby confirming the robustness and real-world generalizability of the model.
To optimize diagnostic performance: fine-tuning the decision threshold to achieve maximum sensitivity and the lowest negative likelihood ratio (LR⁻) for the index test, thereby minimizing false negatives and enhancing the model’s screening utility for early bladder cancer detection.
The entire dataset comprising 127 cases and 262 controls was randomly partitioned into four approximately equal subsets. Among the cases, three folds contained 32 subjects each, and one-fold contained 31 subjects; among the controls, three folds comprised 66 subjects each, and one-fold contained 64 subjects (see Table 4). In each iteration, three folds served as the training set, while the remaining fold was reserved for validation (see Table 5). For instance, in Iteration 1, the LR equation was derived using data from Folds 2–4 and then applied to Fold 1 (containing both cases and controls) to compute logit, odds, and predicted probability values for bladder cancer prediction. The predicted probabilities were compared against the gold-standard histopathological diagnosis across multiple probability cut-offs to classify individuals as “cancer” or “non-cancer.” At each threshold, diagnostic performance indices—including sensitivity, specificity, positive predictive value (PPV), negative predictive value (NPV), and likelihood ratios (LR⁺ and LR⁻)—were calculated to evaluate classification performance across different probability thresholds. The ROC analysis of the full logistic regression model identified a probability threshold of 0.34 using the Youden index, which represents the threshold that maximizes the combined sensitivity and specificity. However, the intended use of the present assay was an initial triage/rule-out strategy, for which minimizing false-negative results was considered more important than achieving the maximum combined sensitivity and specificity. Therefore, during four-fold cross-validation, we evaluated a range of probability thresholds with particular emphasis on sensitivity and negative likelihood ratio (LR−). A probability threshold of 0.25 provided a favourable and relatively consistent sensitivity/LR− profile across the four validation folds and was therefore selected as the operating threshold for the sensitivity-oriented triage analysis. Thus, 0.34 represents the Youden-derived threshold, whereas 0.25 represents the selected operating threshold for the intended triage/rule-out application. Table 6 summarizes the performance indices for each fold, while Figure 7 illustrates how sensitivity, specificity, and LR⁻ varied across different decision thresholds. At a probability cut-off of 0.25, the index test showed a favourable and relatively consistent sensitivity and negative likelihood ratio (LR−) profile across the four validation folds, with a mean sensitivity of 0.83 ± 0.05 and a mean LR− of 0.36 ± 0.10. The corresponding mean specificity was 0.47 ± 0.03, indicating consistent and high ability to detect true cancer cases while moderately excluding non-cases (see Table 7). The corresponding mean PPV and NPV were 0.43 ± 0.02 and 0.85 ± 0.04, respectively, reaffirming the test’s strength as a reliable rule-out tool. The mean LR⁺ and LR⁻ were 1.58 ± 0.10 and 0.36 ± 0.10, respectively, suggesting that a positive result modestly increases, while a negative result substantially decreases, the likelihood of bladder cancer. When applied to a urological clinic population—where the disease prevalence is typically higher than in the general population—and considering a pre-test probability of 33%, the model’s likelihood ratios translate into meaningful post-test probability shifts. Specifically, a positive test increases the probability of cancer from 33% to approximately 44%, whereas a negative test reduces it to about 15% as illustrated in the Fagan's nomogram (see Figure 8). This pattern implies that a positive result warrants further confirmatory evaluation (e.g., cystoscopy or imaging), while a negative result substantially reduces the likelihood of malignancy, providing reassurance to both clinician and patient. The overall sensitivity (0.83 ± 0.05) and NPV (0.85 ± 0.04) highlight the model’s potential as a non-invasive triage or screening tool for ruling out bladder cancer in at-risk individuals using naturally voided, specific gravity–normalized urine samples. The probability cut-off of 0.25 thus represents the “sweet spot” for early detection, yielding the highest mean sensitivity and lowest mean LR⁻ across all four folds (see Table 7). This threshold optimally minimizes false negatives, underscoring the model’s robustness and clinical applicability for screening and early detection purposes. Finally, the logistic regression equation derived from the full dataset of 127 cases and 262 controls (see Table 3) was applied to visualize the classification boundary corresponding to the 0.25 probability threshold. As shown in Figure 9, the black dotted curve represents the model-derived cut-off boundary beyond which individuals are predicted to have bladder cancer (p ≥ 0.25), while those below this line have a predicted probability < 0.25, indicating low likelihood of cancer. This threshold translates the statistical model into clinically interpretable terms—defining the minimum urinary SGN-uTNA concentration required at each age to reach a 25% predicted probability of cancer. The plot demonstrates that with increasing age, progressively lower SGN-uTNA concentrations are sufficient to exceed the 0.25 probability threshold, reflecting the independent contribution of age to cancer risk. Figure 9A displays raw specific gravity–normalized total nucleic acid (SGN-uTNA) concentrations (mg/mL) across age, whereas Figure 9B presents the log₁₀-transformed specific gravity–normalized total nucleic acid values (logSGN-uTNA) with the model-derived threshold indicated by the dashed line. As evident from Figure 2A, which depicts the age distribution of cases, the majority of participants were between 40 and 60 years of age, and the model effectively identifies high-risk individuals within this predominant age group.
Adverse events: No adverse events were associated with the index test. The procedure involved only the collection of a naturally voided urine sample in a sterile container, without any invasive intervention or patient discomfort. As the test is entirely non-invasive and performed on urine specimens collected from the subjects, no risk or adverse effect was anticipated or observed in any participant due to the index test.
|
Table 1. Values are presented as mean ± standard deviation, median (interquartile range), and range, as appropriate. The table summarizes demographic features (age in years) and urinary total nucleic acid concentrations normalized to specific gravity (mg/mL) (SGN-uTNA). Because nucleic acid concentrations were right-skewed, log₁₀-transformed values are also shown; these transformed data approximated a normal distribution and were used for all statistical analyses. |
||||
|
Items |
Subjects |
Age (y) |
SGN-uTNA (mg/ml) |
Log10 transformed SGN-uTNA |
|
N |
Cases |
127 |
127 |
127 |
|
Controls |
262 |
262 |
262 |
|
|
Mean |
Cases |
57.9 |
6.04 |
0.721 |
|
Controls |
47.3 |
4.93 |
0.641 |
|
|
95% CI mean lower bound |
Cases |
55.8 |
5.42 |
0.682 |
|
Controls |
45.8 |
4.59 |
0.617 |
|
|
95% CI mean upper bound |
Cases |
60.1 |
6.66 |
0.760 |
|
Controls |
48.9 |
5.28 |
0.666 |
|
|
Median |
Cases |
58 |
5.07 |
0.705 |
|
Controls |
48.0 |
4.15 |
0.618 |
|
|
Mode |
Cases |
64.0 |
6.10 |
0.785 |
|
Controls |
45.0 |
3.22ᵃ |
0.508ᵃ |
|
|
Standard deviation |
Cases |
12.2 |
3.55 |
0.223 |
|
Controls |
12.5 |
2.84 |
0.201 |
|
|
IQR |
Cases |
13.0 |
3.22 |
0.268 |
|
Controls |
15.8 |
2.27 |
0.232 |
|
|
Range |
Cases |
70 |
18.5 |
1.17 |
|
Controls |
68 |
17.3 |
1.21 |
|
|
Minimum |
Cases |
22 |
1.35 |
0.130 |
|
Controls |
19 |
1.14 |
0.0569 |
|
|
Maximum |
Cases |
92 |
19.9 |
1.30 |
|
Controls |
87 |
18.5 |
1.27 |
|
|
Skewness |
Cases |
-0.301 |
1.77 |
0.310 |
|
Controls |
-0.0248 |
2.24 |
0.684 |
|
|
Std. error skewness |
Cases |
0.215 |
0.215 |
0.215 |
|
Controls |
0.150 |
0.150 |
0.150 |
|
|
Kurtosis |
Cases |
0.523 |
3.29 |
0.264 |
|
Controls |
0.150 |
5.74 |
0.839 |
|
|
Std. error kurtosis |
Cases |
0.427 |
0.427 |
0.427 |
|
Controls |
0.300 |
0.300 |
0.300 |
|
|
Shapiro-Wilk W |
Cases |
0.988 |
0.825 |
0.982 |
|
Controls |
0.986 |
0.765 |
0.963 |
|
|
Shapiro-Wilk p |
Cases |
0.326 |
<.001 |
0.090 |
|
Controls |
0.009 |
<.001 |
<.001 |
|
|
Note. The CI of the mean assumes sample means follow a t-distribution with N - 1 degrees of freedom. |
||||
|
More than one mode exists, only the first is reported SGN-uTNA: Specific gravity-normalised urine total nucleic acid concentration (mg/ml). |
||||
|
Table 2. Model fit measures for the whole dataset and four validation folds. This table presents key logistic regression fit indices, including model deviance, Akaike information criterion (AIC), Bayesian Information Criterion (BIC), Cox & Snell’s R2 (R²CS), Nagelkerke’s R² (R²N), Tjur’s R2 (R²T) and Mcfadden’s R² (R²McF), computed for the full dataset and each of the four validation folds. These statistics reflect the overall goodness of fit and comparative model performance across training and validation subsets. Consistency of AIC, BIC and pseudo-R² values across folds indicates that the model generalizes well, maintaining stable explanatory power and predictive performance in repeated validation analyses. |
||||||||||
|
Model |
Deviance |
AIC |
BIC |
R²McF |
R²CS |
R²N |
R²T |
χ² |
df |
p |
|
Whole data |
434 |
440 |
452 |
0.123 |
0.144 |
0.200 |
0.152 |
60.9 |
2 |
<.001 |
|
Validation Fold 1 |
317 |
323 |
334 |
0.146 |
0.168 |
0.235 |
0.178 |
54.2 |
2 |
<.001 |
|
Validation Fold 2 |
319 |
325 |
336 |
0.131 |
0.153 |
0.213 |
0.163 |
48.3 |
2 |
<.001 |
|
Validation Fold 3 |
327 |
333 |
344 |
0.110 |
0.130 |
0.182 |
0.139 |
40.6 |
2 |
<.001 |
|
Validation Fold 4 |
326 |
332 |
343 |
0.113 |
0.134 |
0.186 |
0.140 |
41.7 |
2 |
<.001 |
|
Note. Models estimated using sample size of n=392 (Whole data), n=294 (Validation Fold 1), n=291 (Validation Fold 2, 3 and 4), AIC: Akaike information criterion, BIC: Bayesian Information Criterion, R²McF: McFadden’s R², R²CS: Cox & Snell’s R2, R²N: Nagelkerke's R² , R²T: Tjur’s R2 |
||||||||||
|
Table 3. Model Coefficients derived from the whole dataset and four validation folds. This table summarizes the logistic regression model coefficients obtained using the complete dataset and during four-fold internal validation. For each validation fold (1–4), the coefficients correspond to the predictors — LogSGN-uTNA and age — used to classify cancer status (case vs. control). The direction and magnitude of the coefficients indicate the strength and consistency of association across folds. The model trained on the full dataset serves as a reference, while coefficients from the validation folds demonstrate the model’s robustness and stability across subsets of data. |
||||||||||
|
Items
|
|
95% Confidence Interval
|
|
|
|
|
95% Confidence Interval
|
|||
|
Predictor |
Estimate |
Lower |
Upper |
SE |
Z |
p |
Odds ratio |
Lower |
Upper |
|
|
Whole data |
|
|
|
|
|
|
|
|
||
|
Intercept |
-4.8137 |
-6.0542 |
-3.5731 |
0.6330 |
-7.60 |
<.001 |
0.00812 |
0.00235 |
0.0281 |
|
|
LogSGN-uTNA |
0.7157 |
-0.2655 |
1.6969 |
0.5006 |
1.43 |
0.153 |
2.04562 |
0.76684 |
5.4569 |
|
|
Age (y) |
0.0682 |
0.0472 |
0.0893 |
0.0107 |
6.35 |
<.001 |
1.07060 |
1.04829 |
1.0934 |
|
|
Validation Fold 1 |
|
|
|
|
|
|
|
|
||
|
Intercept |
-5.4196 |
-6.9381 |
-3.9011 |
0.7748 |
-7.00 |
<.001 |
0.00443 |
9.70e-4 |
0.0202 |
|
|
LogSGN-uTNA |
1.3131 |
0.0159 |
2.6102 |
0.6618 |
1.98 |
0.047 |
3.71761 |
1.02 |
13.6022 |
|
|
Age (y) |
0.0721 |
0.0469 |
0.0973 |
0.0129 |
5.60 |
<.001 |
1.07471 |
1.05 |
1.1021 |
|
|
Validation Fold 2 |
|
|
|
|
|
|
|
|
||
|
Intercept |
-4.8215 |
-6.2695 |
-3.3734 |
0.7388 |
-6.526 |
<.001 |
0.00806 |
0.00189 |
0.0343 |
|
|
LogSGN-uTNA |
0.4780 |
-0.8084 |
1.7645 |
0.6564 |
0.728 |
0.466 |
1.61290 |
0.44556 |
5.8386 |
|
|
Age (y) |
0.0708 |
0.0466 |
0.0951 |
0.0124 |
5.727 |
<.001 |
1.07340 |
1.04769 |
1.0997 |
|
|
Validation Fold 3 |
|
|
|
|
|
|
|
|
||
|
Intercept |
-4.5688 |
-5.9916 |
-3.1460 |
0.7259 |
-6.29 |
<.001 |
0.0104 |
0.00250 |
0.0430 |
|
|
LogSGN-uTNA |
0.8162 |
-0.4478 |
2.0803 |
0.6449 |
1.27 |
0.206 |
2.2620 |
0.63901 |
8.0070 |
|
|
Age (y) |
0.0627 |
0.0390 |
0.0865 |
0.0121 |
5.17 |
<.001 |
1.0647 |
1.03972 |
1.0903 |
|
|
Validation Fold 4 |
|
|
|
|
|
|
|
|
||
|
Intercept |
-4.6119 |
-6.0370 |
-3.1868 |
0.7271 |
-6.343 |
<.001 |
0.00993 |
0.00239 |
0.0413 |
|
|
LogSGN-uTNA |
0.5026 |
-0.7049 |
1.7101 |
0.6161 |
0.816 |
0.415 |
1.65300 |
0.49413 |
5.5297 |
|
|
Age (y) |
0.0677 |
0.0428 |
0.0926 |
0.0127 |
5.330 |
<.001 |
1.07003 |
1.04372 |
1.0970 |
|
|
Note. Estimates represent the log odds of "Urinary bladder cancer = Yes" vs. "Urinary bladder cancer = NO" |
||||||||||
|
Table 4. Distribution of study subjects across four folds. The dataset was randomly divided into four subsets for internal cross-validation during model training and validation, ensuring a balanced representation of cases and controls in each fold. Each fold contained approximately equal numbers of subjects, with a total of 262 controls and 127 cases distributed across the four folds. |
||
|
Subsets |
Controls (n) |
Cases (n) |
|
Fold 1 |
64 |
31 |
|
Fold 2 |
66 |
32 |
|
Fold 3 |
66 |
32 |
|
Fold 4 |
66 |
32 |
|
Total |
262 |
127 |
|
Table 5. Scheme of four-fold cross-validation. In the internal four-fold cross-validation approach, the dataset was randomly partitioned into four subsets (folds). During each iteration, one-fold served as the validation set, while the remaining three folds were used for model training. This process was repeated four times so that each fold was used once for validation and three times for training, ensuring unbiased model evaluation. |
||||
|
Items |
Iteration 1 |
Iteration 2 |
Iteration 3 |
Iteration 4 |
|
Validation set |
Fold 1 |
Fold 2 |
Fold 3 |
Fold 4 |
|
Model training sets |
Fold 2, 3 and 4 |
Fold 1, 3 and 4 |
Fold 1, 2 and 4 |
Fold 1, 2 and 3 |
|
Table 6. Diagnostic performance of the logistic regression model across four validation folds at varying cut-offs (0.33–0.20). The table presents sensitivity, specificity, positive predictive values (PPV), negative predicative values (NPV), and positive (LR⁺) and negative ((LR⁻) likelihood ratio respectively. Sensitivity remained high across folds, with optimal balance and the lowest LR⁻ values observed around the 0.25 cut-off, indicating its suitability for early cancer detection. |
|||||||
|
Cut-off |
Sensitivity |
Specificity |
PPV |
NPV |
LR+ |
LR- |
|
|
Validation Fold 1 |
|
|
|
|
|
|
|
|
|
0.33 |
0.71 |
0.64 |
0.49 |
0.82 |
1.97 |
0.45 |
|
0.26 |
0.81 |
0.48 |
0.43 |
0.84 |
1.56 |
0.40 |
|
|
0.25 |
0.84 |
0.44 |
0.42 |
0.85 |
1.49 |
0.37 |
|
|
0.24 |
0.84 |
0.44 |
0.42 |
0.85 |
1.49 |
0.37 |
|
|
0.23 |
0.84 |
0.42 |
0.41 |
0.84 |
1.45 |
0.38 |
|
|
0.2 |
0.84 |
0.38 |
0.39 |
0.83 |
1.34 |
0.43 |
|
|
Validation Fold 2 |
|
|
|
|
|
|
|
|
|
0.33 |
0.63 |
0.73 |
0.53 |
0.80 |
2.29 |
0.52 |
|
0.26 |
0.72 |
0.52 |
0.42 |
0.79 |
1.48 |
0.55 |
|
|
0.25 |
0.75 |
0.50 |
0.42 |
0.80 |
1.50 |
0.50 |
|
|
0.24 |
0.75 |
0.47 |
0.41 |
0.79 |
1.41 |
0.53 |
|
|
0.23 |
0.78 |
0.42 |
0.40 |
0.80 |
1.36 |
0.52 |
|
|
0.2 |
0.81 |
0.32 |
0.37 |
0.78 |
1.19 |
0.59 |
|
|
Validation Fold 3 |
|
|
|
|
|
|
|
|
|
0.33 |
0.78 |
0.70 |
0.56 |
0.87 |
2.58 |
0.31 |
|
0.26 |
0.84 |
0.52 |
0.46 |
0.87 |
1.74 |
0.30 |
|
|
0.25 |
0.84 |
0.48 |
0.44 |
0.86 |
1.64 |
0.32 |
|
|
0.24 |
0.84 |
0.45 |
0.43 |
0.86 |
1.55 |
0.34 |
|
|
0.23 |
0.88 |
0.41 |
0.42 |
0.87 |
1.48 |
0.31 |
|
|
0.2 |
0.91 |
0.30 |
0.39 |
0.87 |
1.30 |
0.31 |
|
|
Validation Fold 4 |
|
|
|
|
|
|
|
|
|
0.33 |
0.66 |
0.74 |
0.55 |
0.82 |
2.55 |
0.46 |
|
|
0.26 |
0.84 |
0.48 |
0.44 |
0.86 |
1.64 |
0.32 |
|
0.25 |
0.88 |
0.48 |
0.45 |
0.89 |
1.70 |
0.26 |
|
|
0.24 |
0.88 |
0.45 |
0.44 |
0.88 |
1.60 |
0.28 |
|
|
0.23 |
0.88 |
0.35 |
0.39 |
0.85 |
1.34 |
0.36 |
|
|
0.2 |
0.91 |
0.30 |
0.39 |
0.87 |
1.30 |
0.31 |
|
|
Table 7. Descriptive statistics of model performance at a predictive probability cut-off of 0.25 across the four validation folds. This table summarizes key mean diagnostic metrics—sensitivity, specificity, positive predictive value (PPV), negative predictive value (NPV), and likelihood ratios (LR⁺, LR⁻)—computed for each validation set at the optimal 0.25 cut-off. The results demonstrate consistent high sensitivity and low LR⁻ values across folds, confirming the model’s reliability in identifying positive cases at this screening threshold. |
|||||
|
Metric |
Valid (N) |
Mean |
Std. Deviation |
Minimum |
Maximum |
|
Sensitivity |
4 |
0.83 |
0.05 |
0.75 |
0.88 |
|
Specificity |
4 |
0.47 |
0.03 |
0.44 |
0.50 |
|
PPV |
4 |
0.43 |
0.02 |
0.42 |
0.45 |
|
NPV |
4 |
0.85 |
0.04 |
0.80 |
0.89 |
|
LR+ |
4 |
1.58 |
0.10 |
1.49 |
1.70 |
|
LR- |
4 |
0.36 |
0.10 |
0.26 |
0.50 |
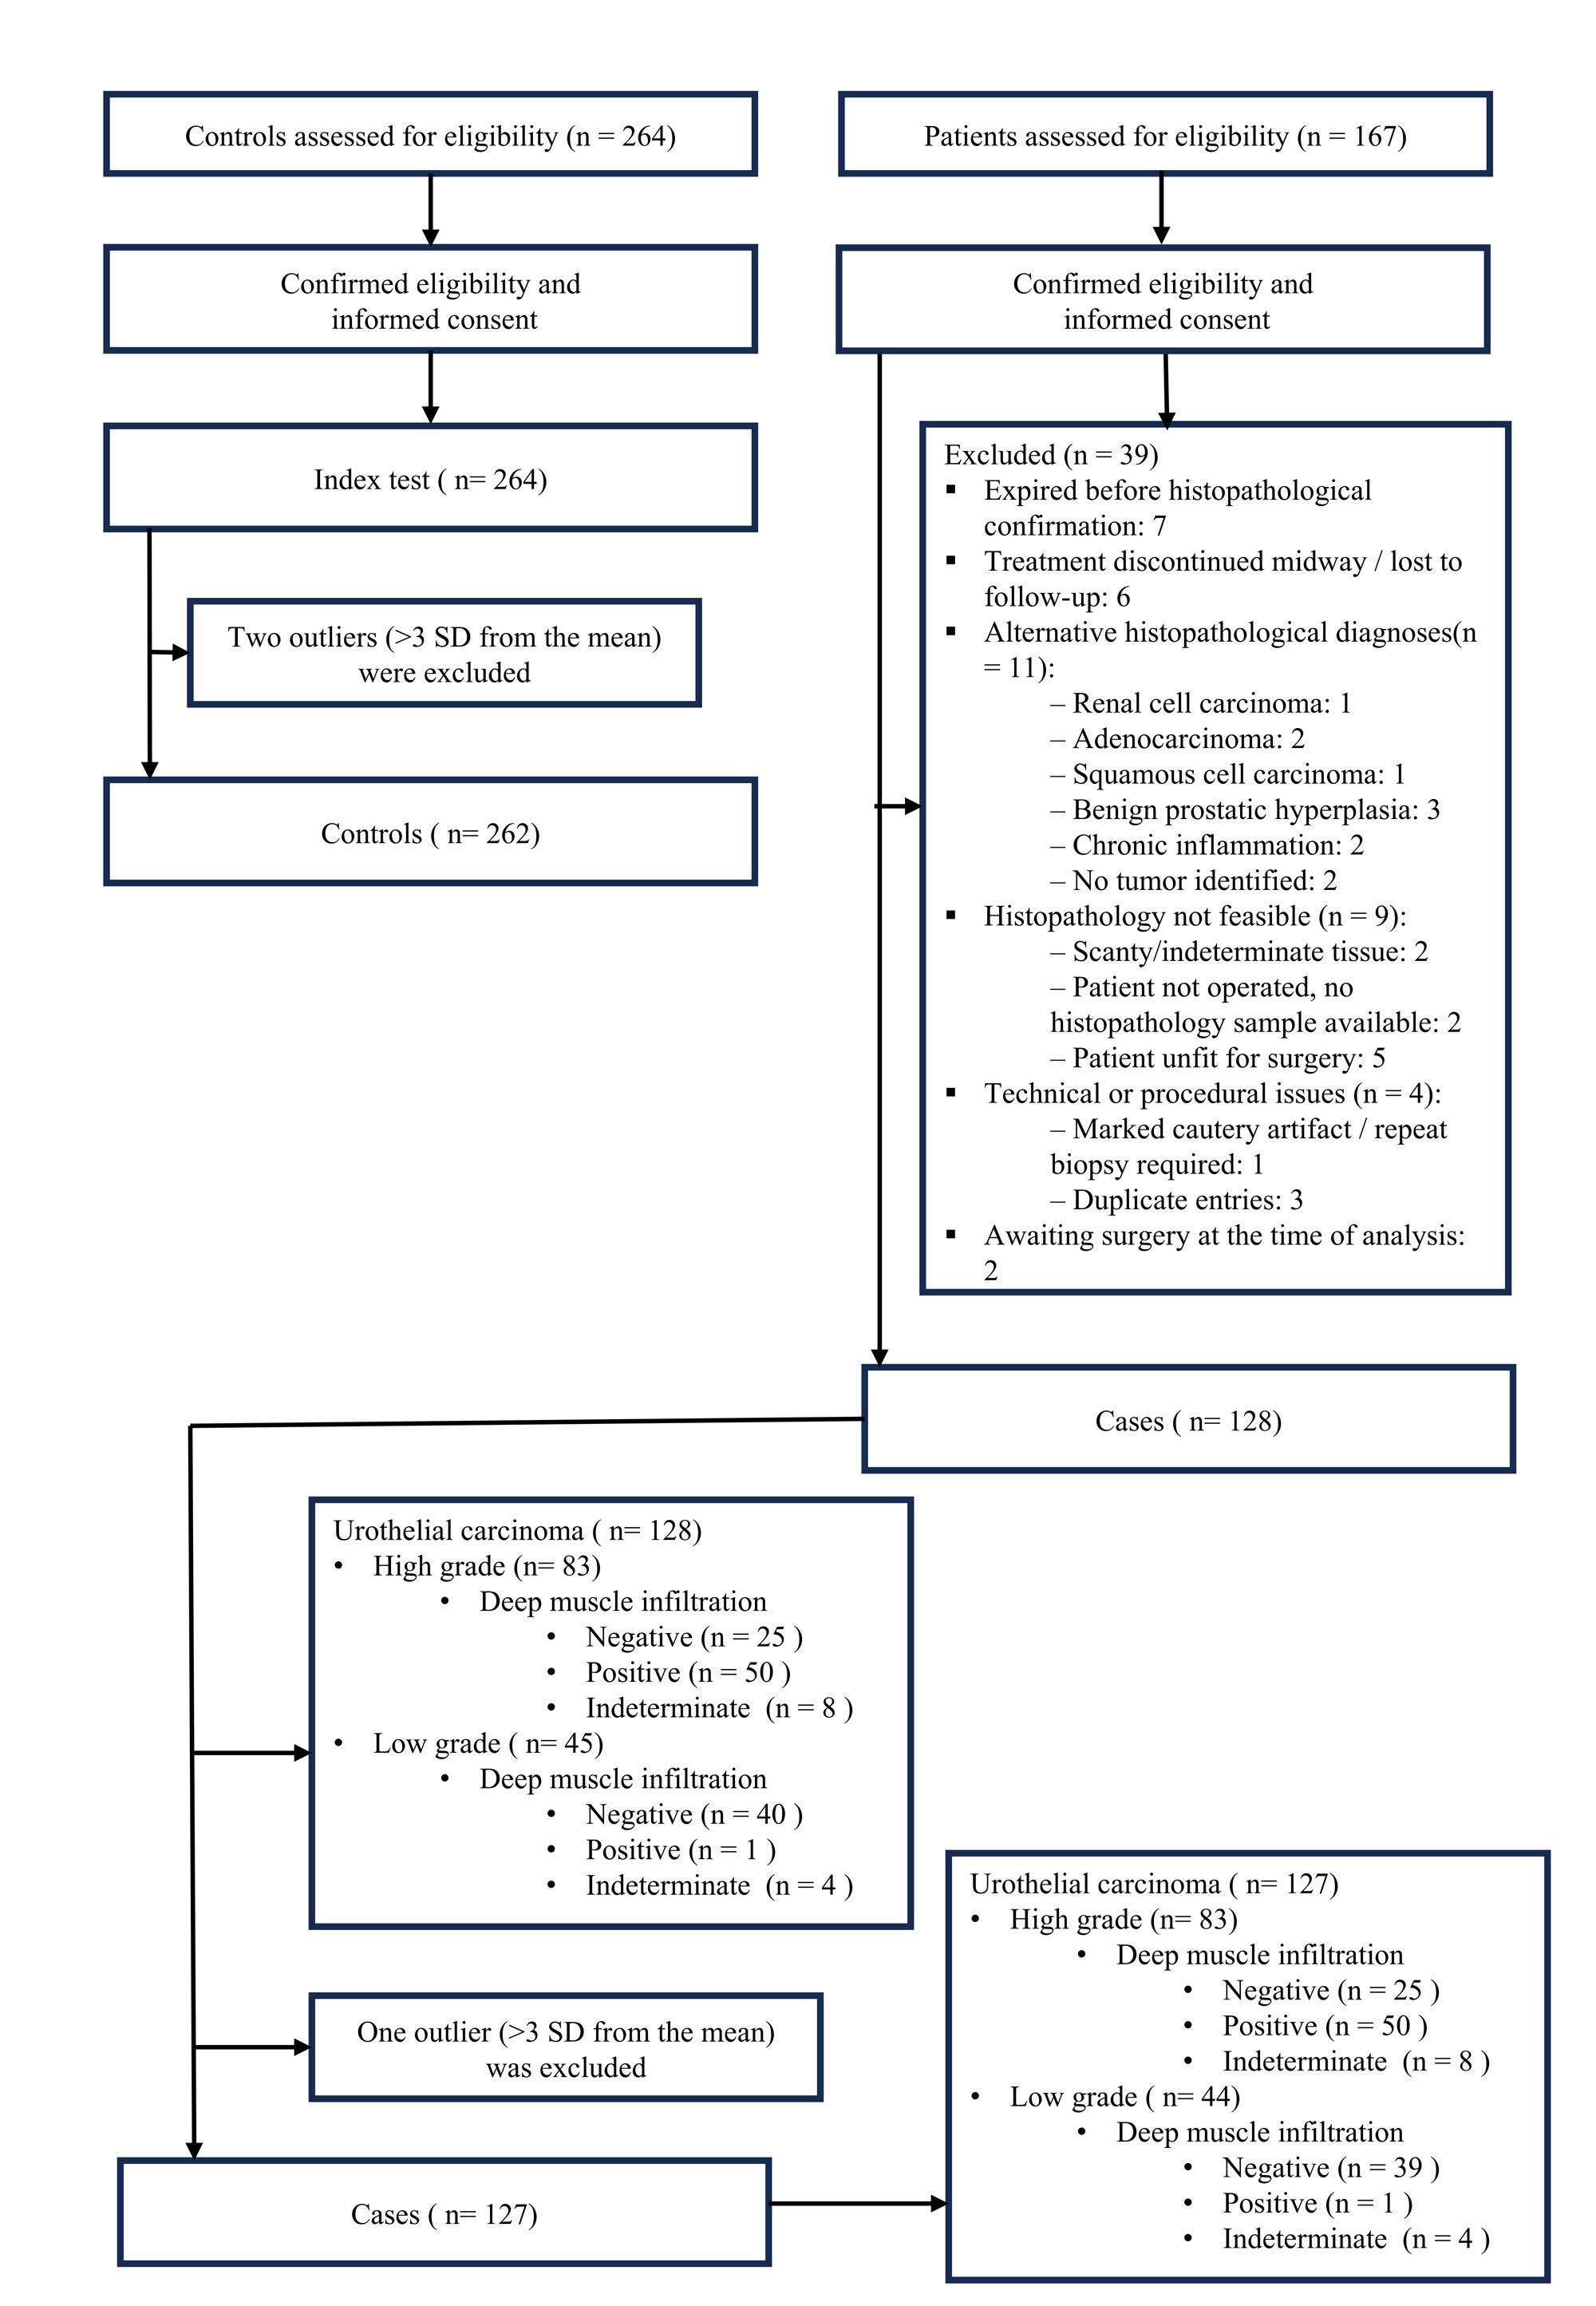 Figure 1. Flow of participants through the study. During the study period (September 2023 to August 2025), 167 suspected bladder cancer patients and 264 healthy controls were enrolled. After exclusions (detailed in the diagram), 127 histopathologically confirmed urothelial carcinoma cases and 262 controls were included in the final analysis. Among the cases, 83 were high grade (25 free of deep muscle infiltration, 50 with infiltration, 8 not defined) and 44 were low grade (39 free of deep muscle infiltration, 1 with infiltration, 4 not defined).
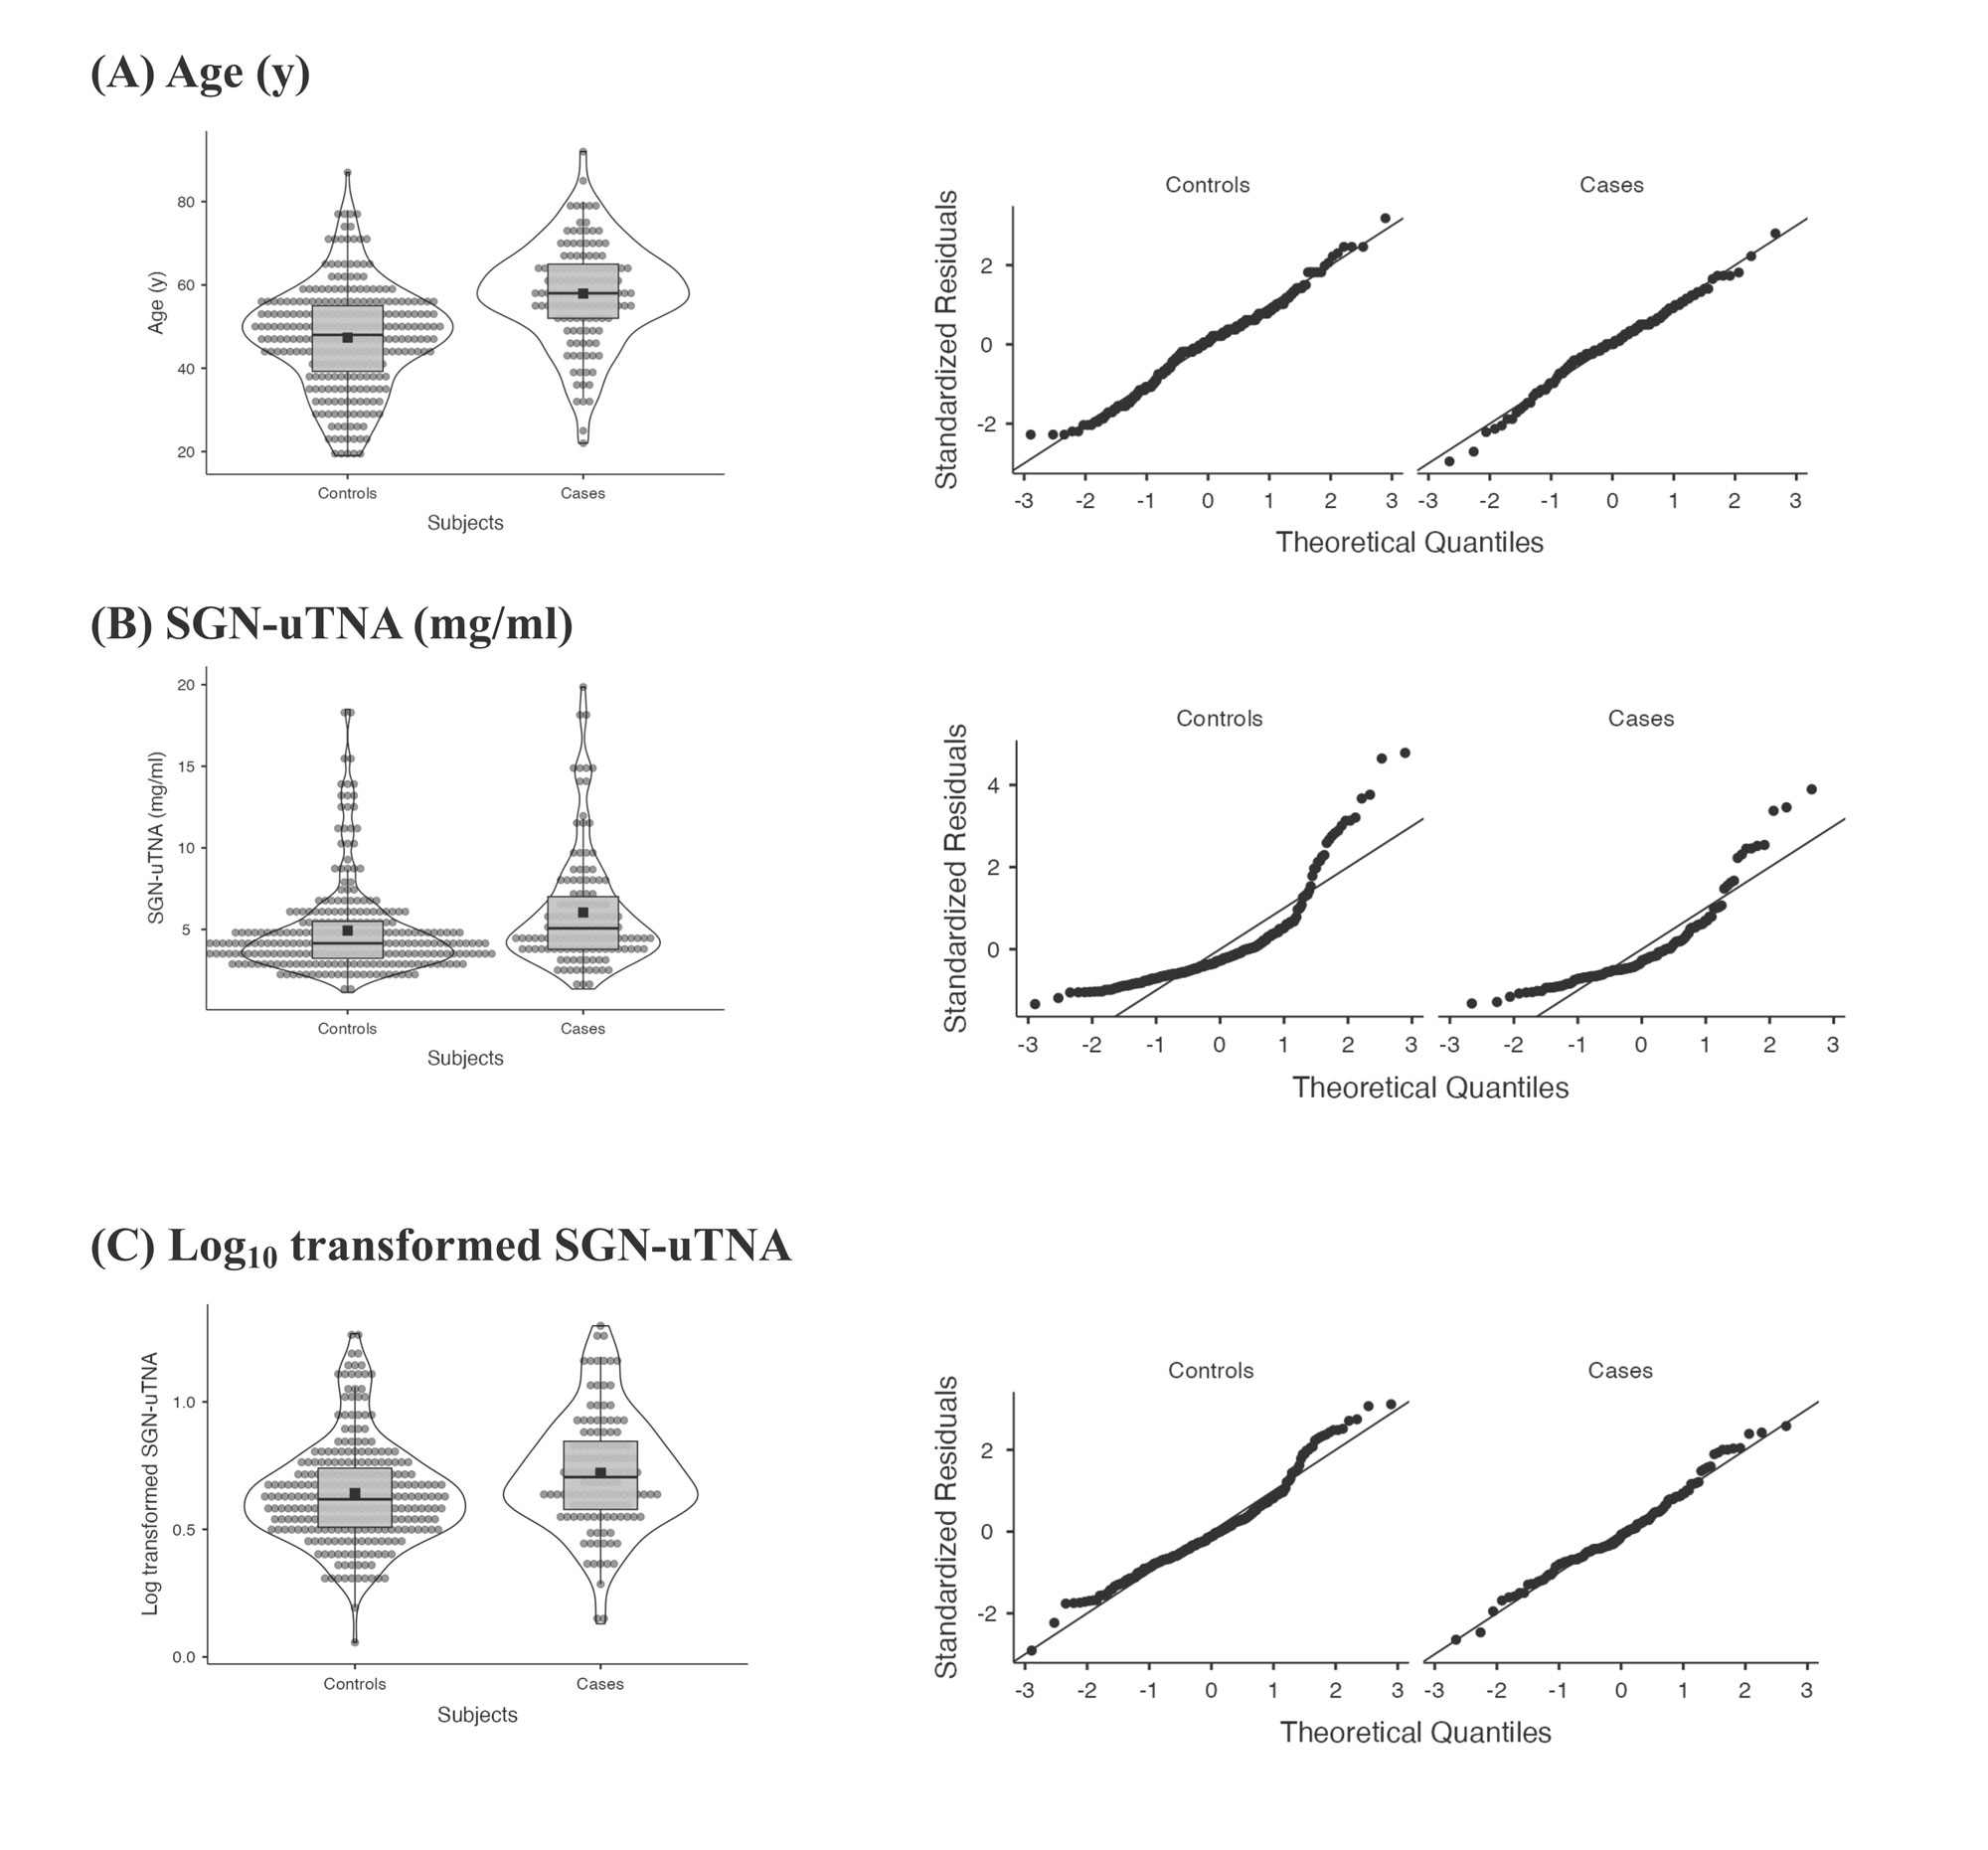 Figure 2. Boxplots and Q–Q plots for (A) Age, (B) SGN-uTNA, and (C) Log₁₀-transformed SGN-uTNA. While age approximated a normal distribution, raw SGN-uTNA was markedly right-skewed. Log transformation produced a more symmetric distribution with points closely following the normal Q–Q line.
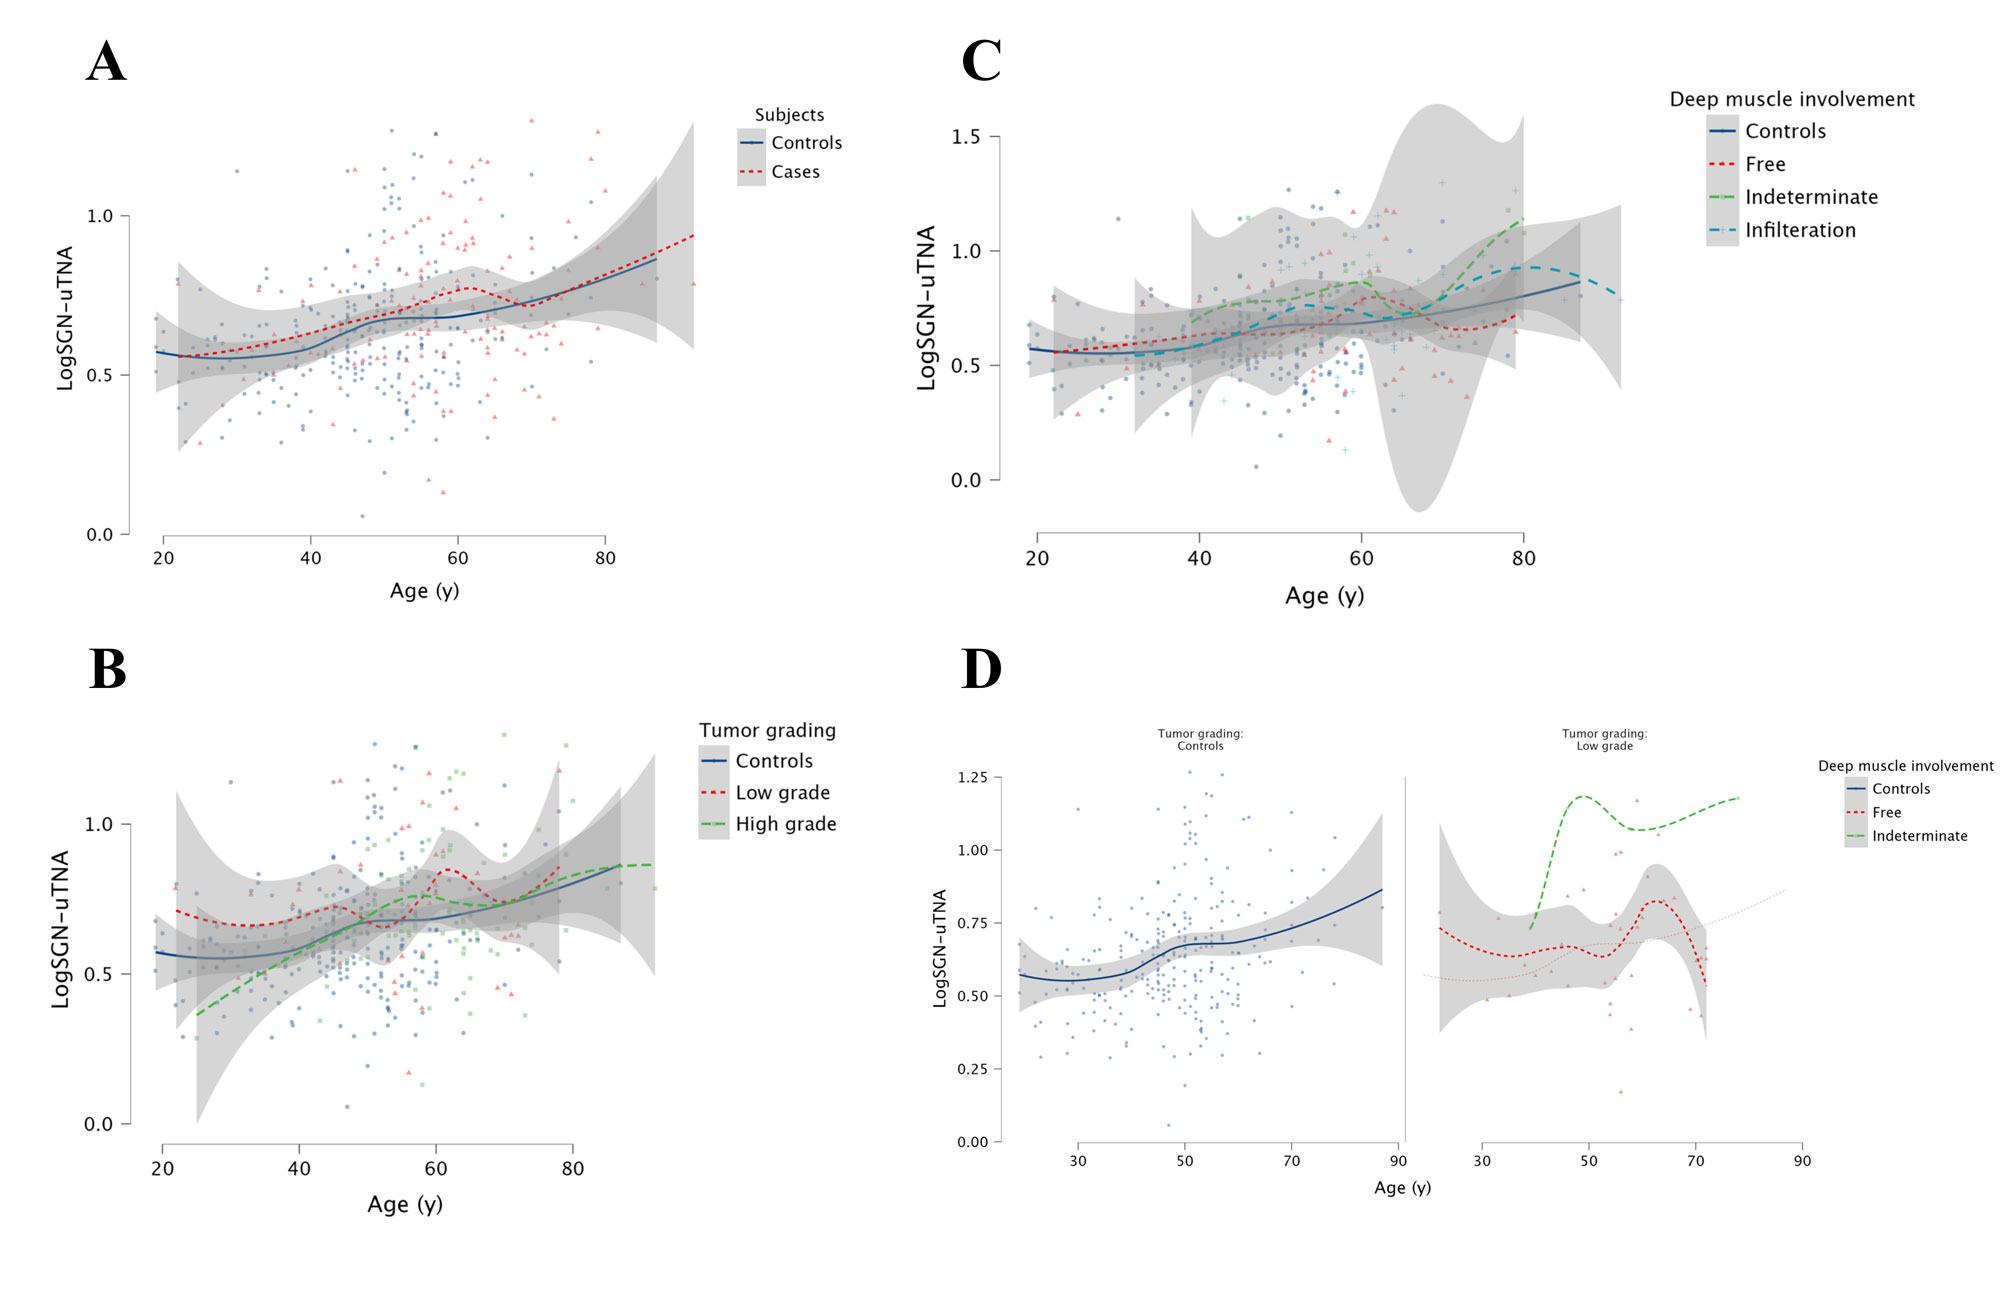 Figure 3. Relationship of log₁₀-transformed urinary SGN-uTNA concentrations with age and tumour characteristics. (A) Scatter plot of age versus log₁₀-transformed SGN-uTNA showing that bladder-cancer cases have consistently higher values than controls across all ages. (B) Scatter plot comparing controls with low-grade and high-grade tumours, demonstrating higher mean log- SGN-uTNA levels in low-grade cases. (C) Scatter plot comparing controls with deep muscle-free, deep muscle-indeterminate and deep muscle-infiltrated tumours, showing markedly elevated log-SGN-uTNA concentrations in muscle-infiltrated disease. (D) Scatter plot restricted to low-grade tumours without deep-muscle infiltration and their matched controls, illustrating that even within this early disease subgroup, log-SGN-uTNA levels remain higher than in controls.
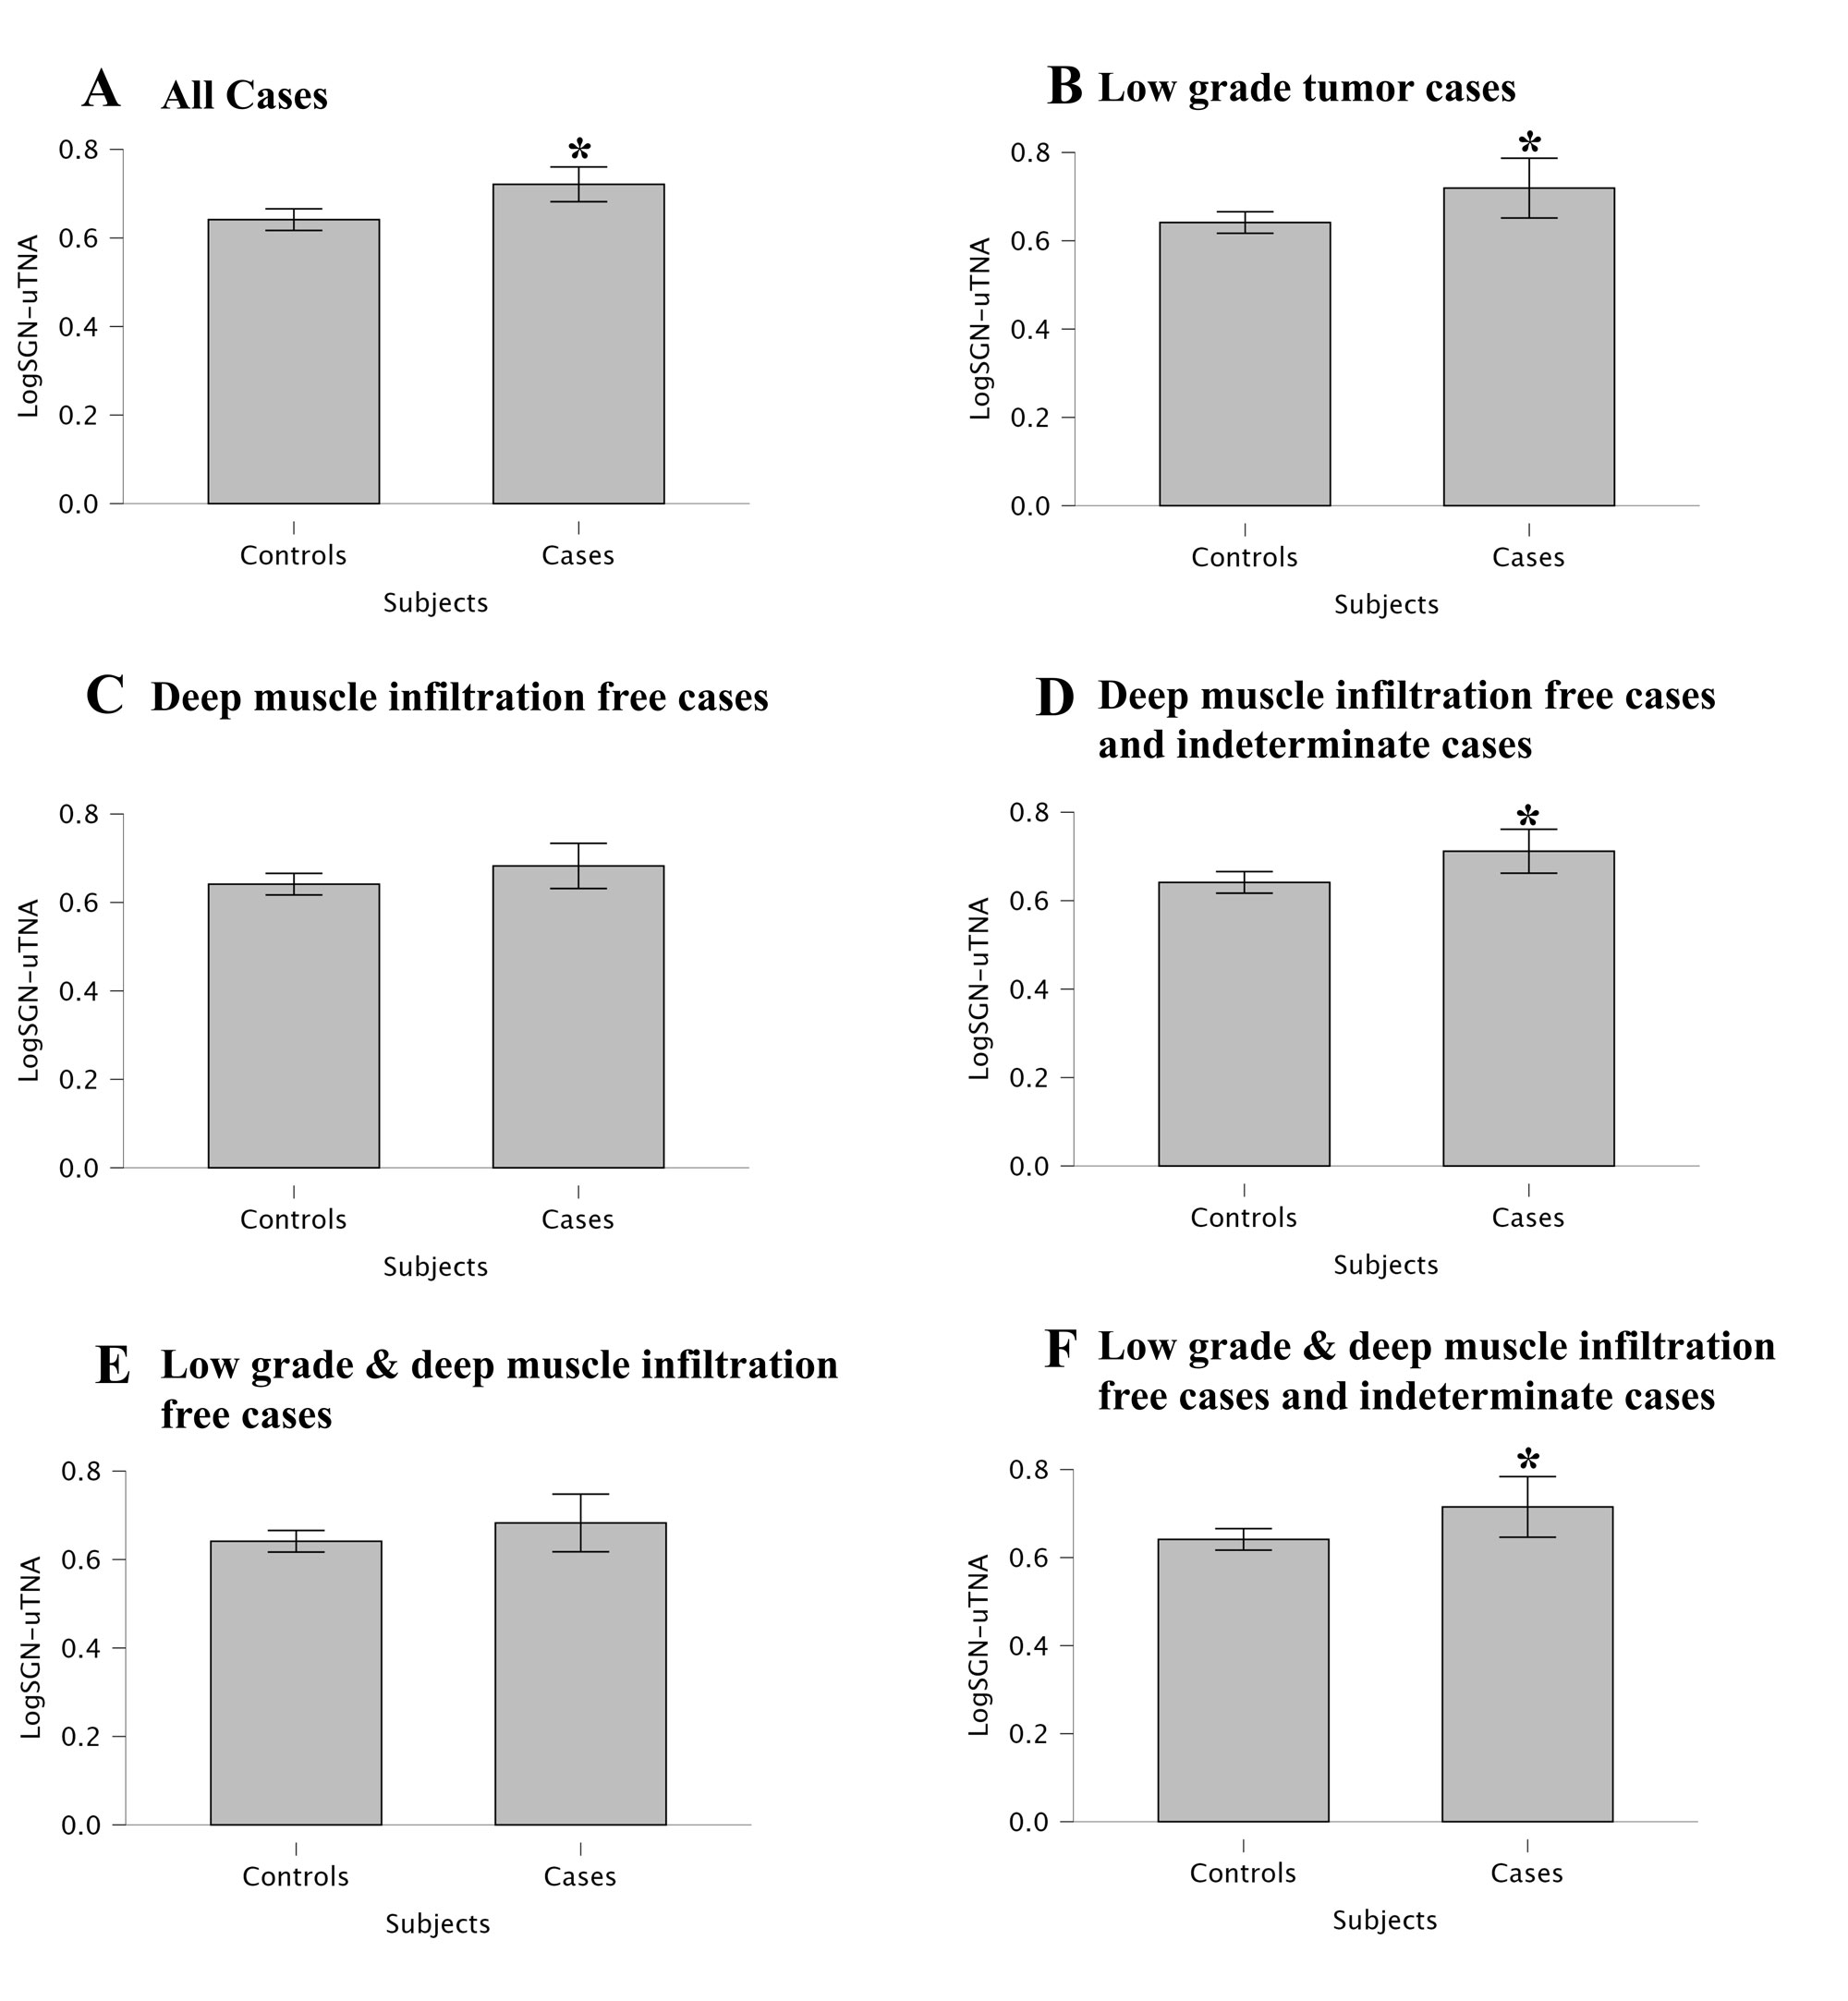 Figure 4. Bar graph showing mean log₁₀-transformed urinary SGN-uTNA concentrations with 95 % confidence intervals in controls and cases (independent-samples t-test; JASP). (A) All controls (n = 262) vs cases (n = 127): significant difference (p = 4.49×10⁻⁴). (B) Low-grade tumours (n = 44) vs controls (n = 262): significant (p = 0.02). (C) Deep-muscle-free tumours (n = 64) vs controls (n = 262): not significant (p = 0.14). (D) Deep-muscle-free plus indeterminate tumours cases (n = 76) vs controls (n = 262): significant (p = 8.58×10⁻³). (E) Low-grade, deep-muscle-free tumours (n = 39) vs controls (n = 262): not significant (p = 0.23). (F) Low-grade, deep-muscle-free plus indeterminate tumours (n = 43) vs controls (n = 262): significant (p = 0.03).
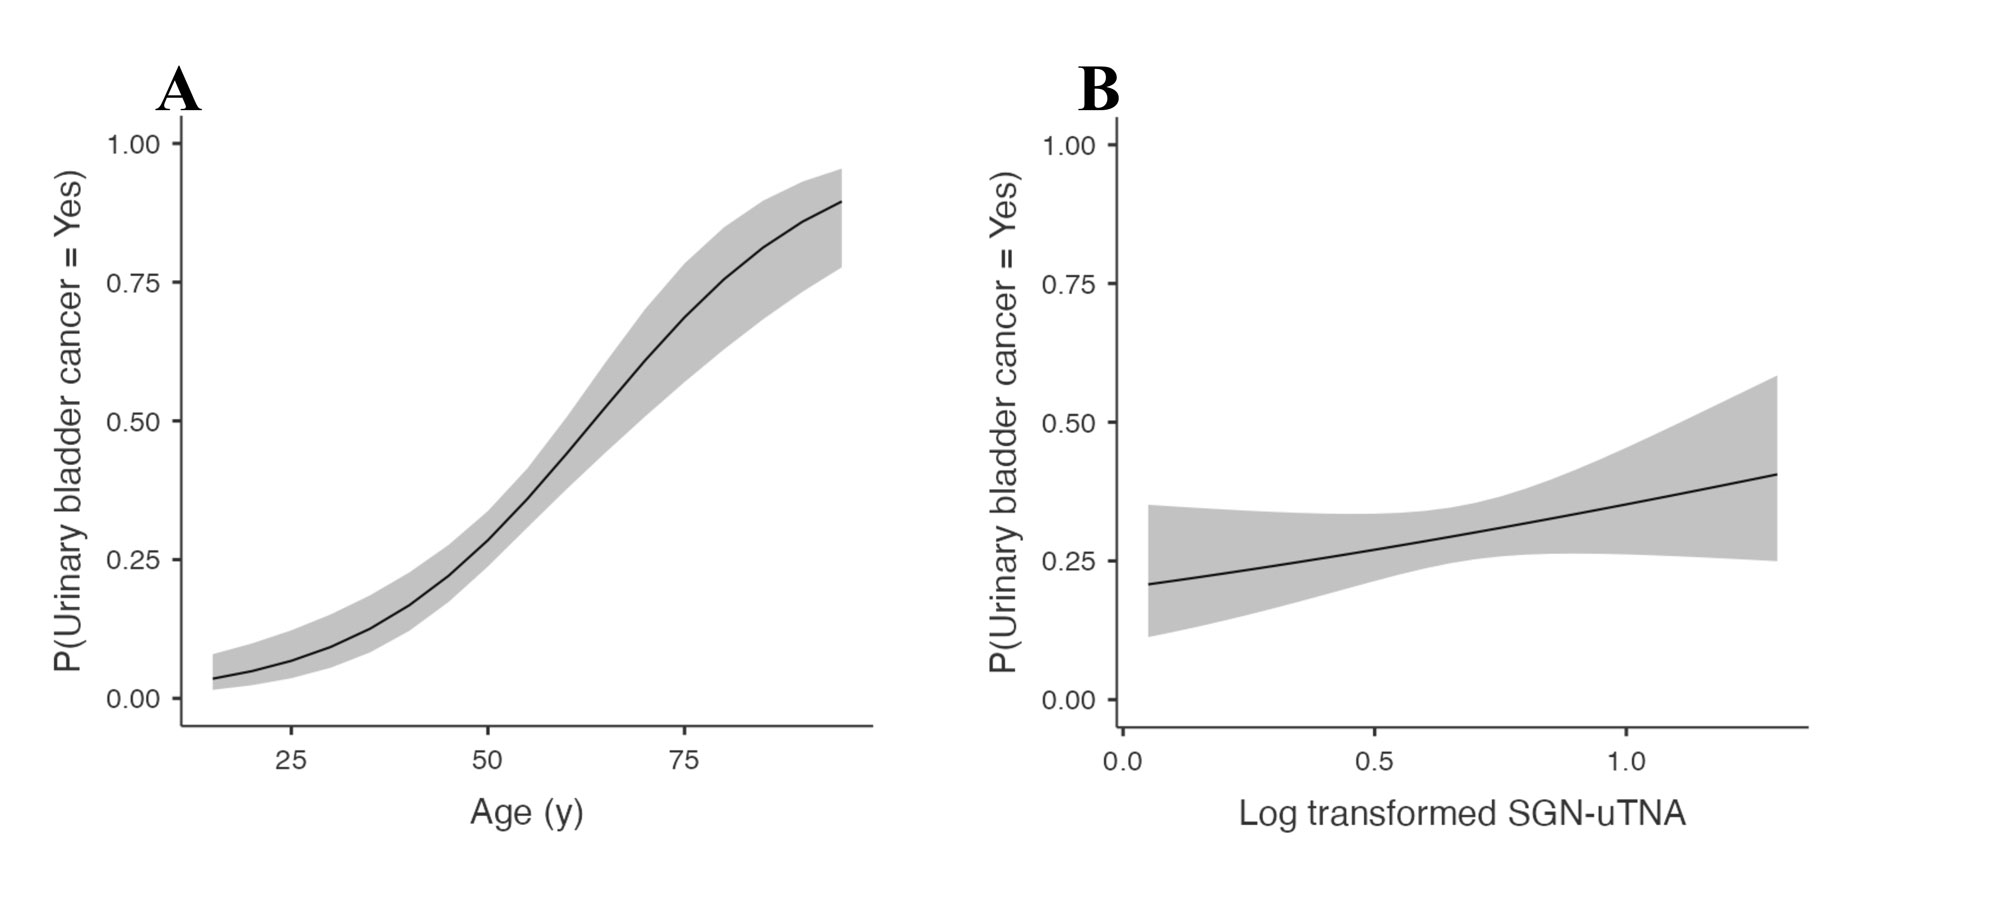 Figure 5. Logistic regression model showing the predictive effect of age and urinary log₁₀-transformed SGN-uTNA on bladder-cancer status. The figure illustrates that the probability of bladder cancer increases with both age (A) and advancing higher urinary SGN-uTNA concentrations (B). Among the predictors, age is statistically significant (p < 0.001), whereas log₁₀-transformed SGN-uTNA shows a positive but non-significant trend (p = 0.168).
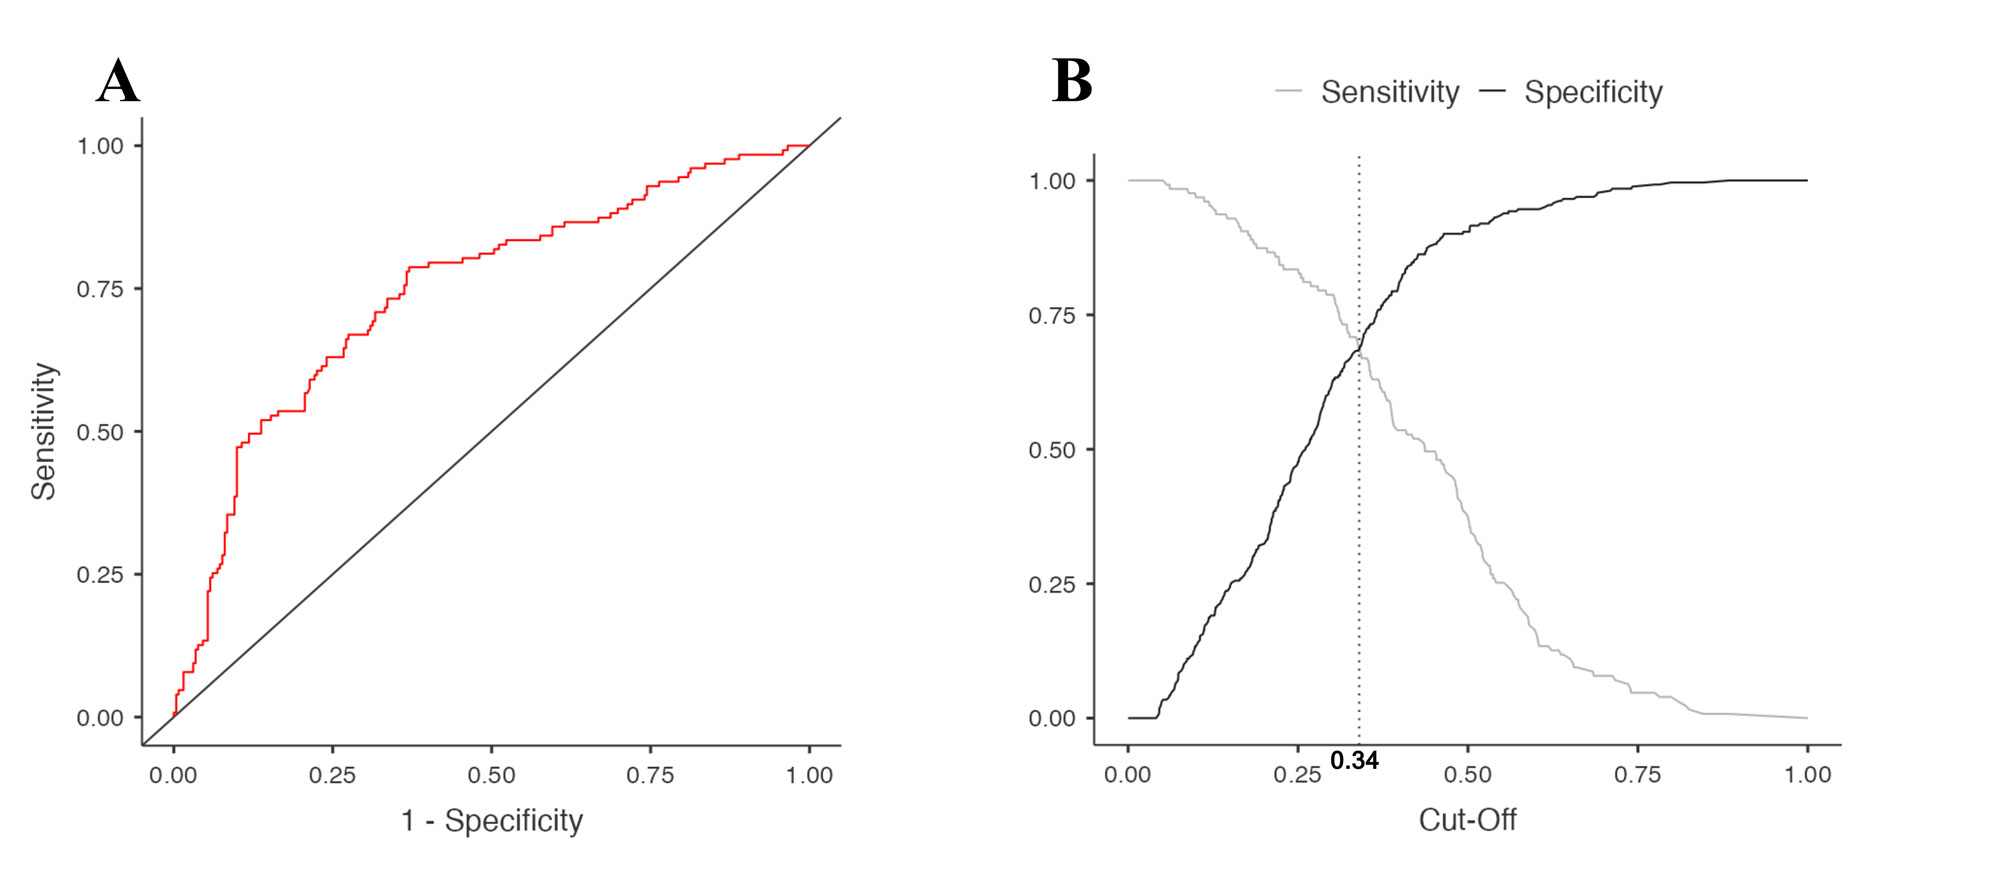 Figure 6. ROC curve for the logistic regression model using age and urinary log₁₀-transformed SGN-uTNA to predict bladder-cancer status. The figure shows the receiver operating characteristic (ROC) curve (A) derived from the logistic regression model incorporating age and log₁₀-transformed urinary SGN-uTNA as predictors. The curve demonstrates good discriminative ability with an area under the curve (AUC) of 0.744, indicating that the model can effectively differentiate bladder-cancer cases from controls. The optimal cut-off probability of 0.34, determined using the Youden index, represents the point of maximum combined sensitivity and specificity (B).
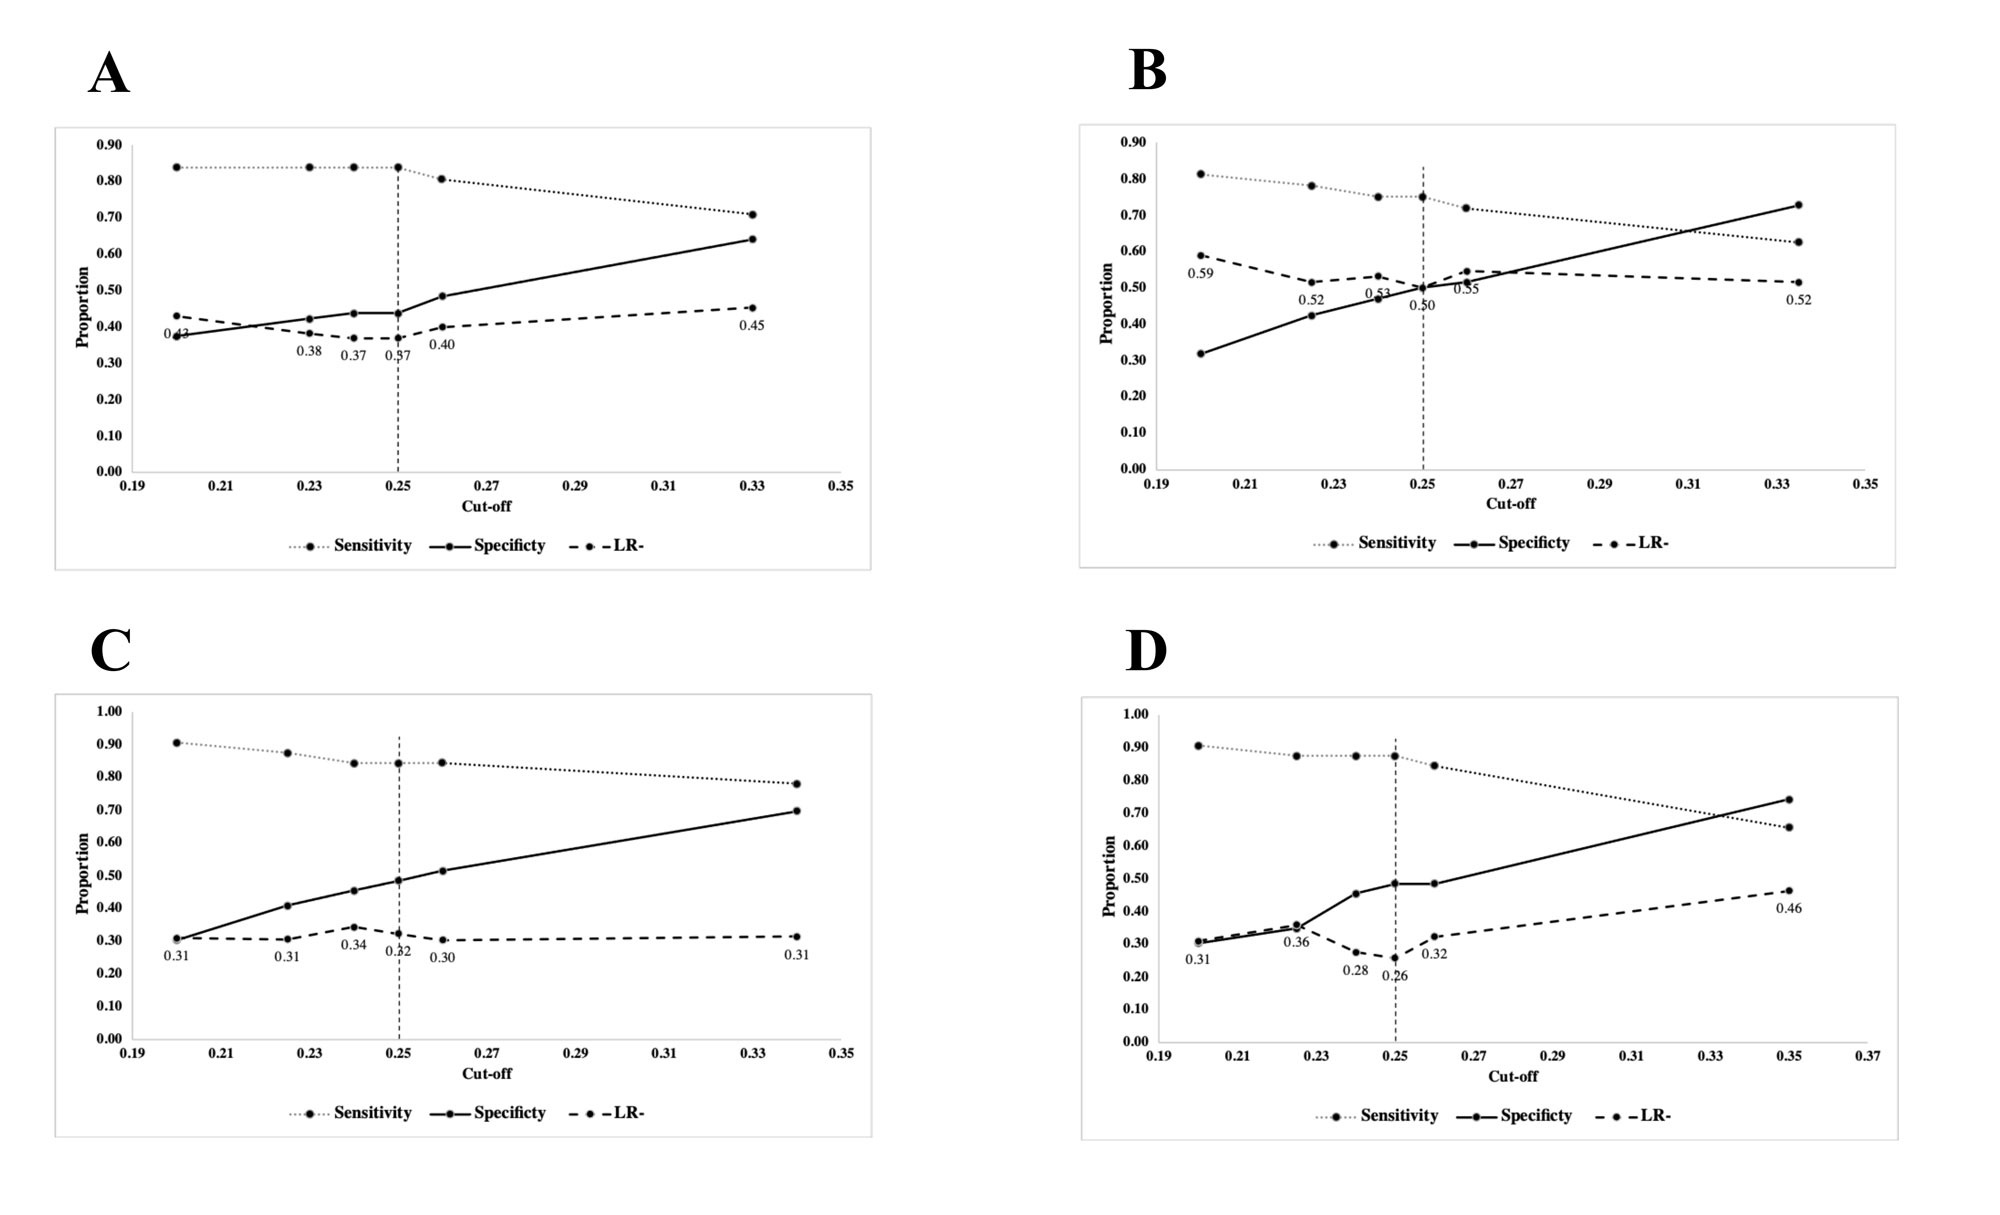 Figure 7. Relationship between model sensitivity and negative likelihood ratio (LR⁻) across varying cut-off probabilities in all four validation folds. Panels A, B, C, and D correspond to validation folds 1, 2, 3, and 4, respectively. Although specificity is also plotted, the key finding is that a probability cut-off of 0.25 provided a favourable sensitivity and LR⁻ profile across the validation folds and was therefore selected as the operating cut-off for the sensitivity-oriented triage/rule-out strategy.
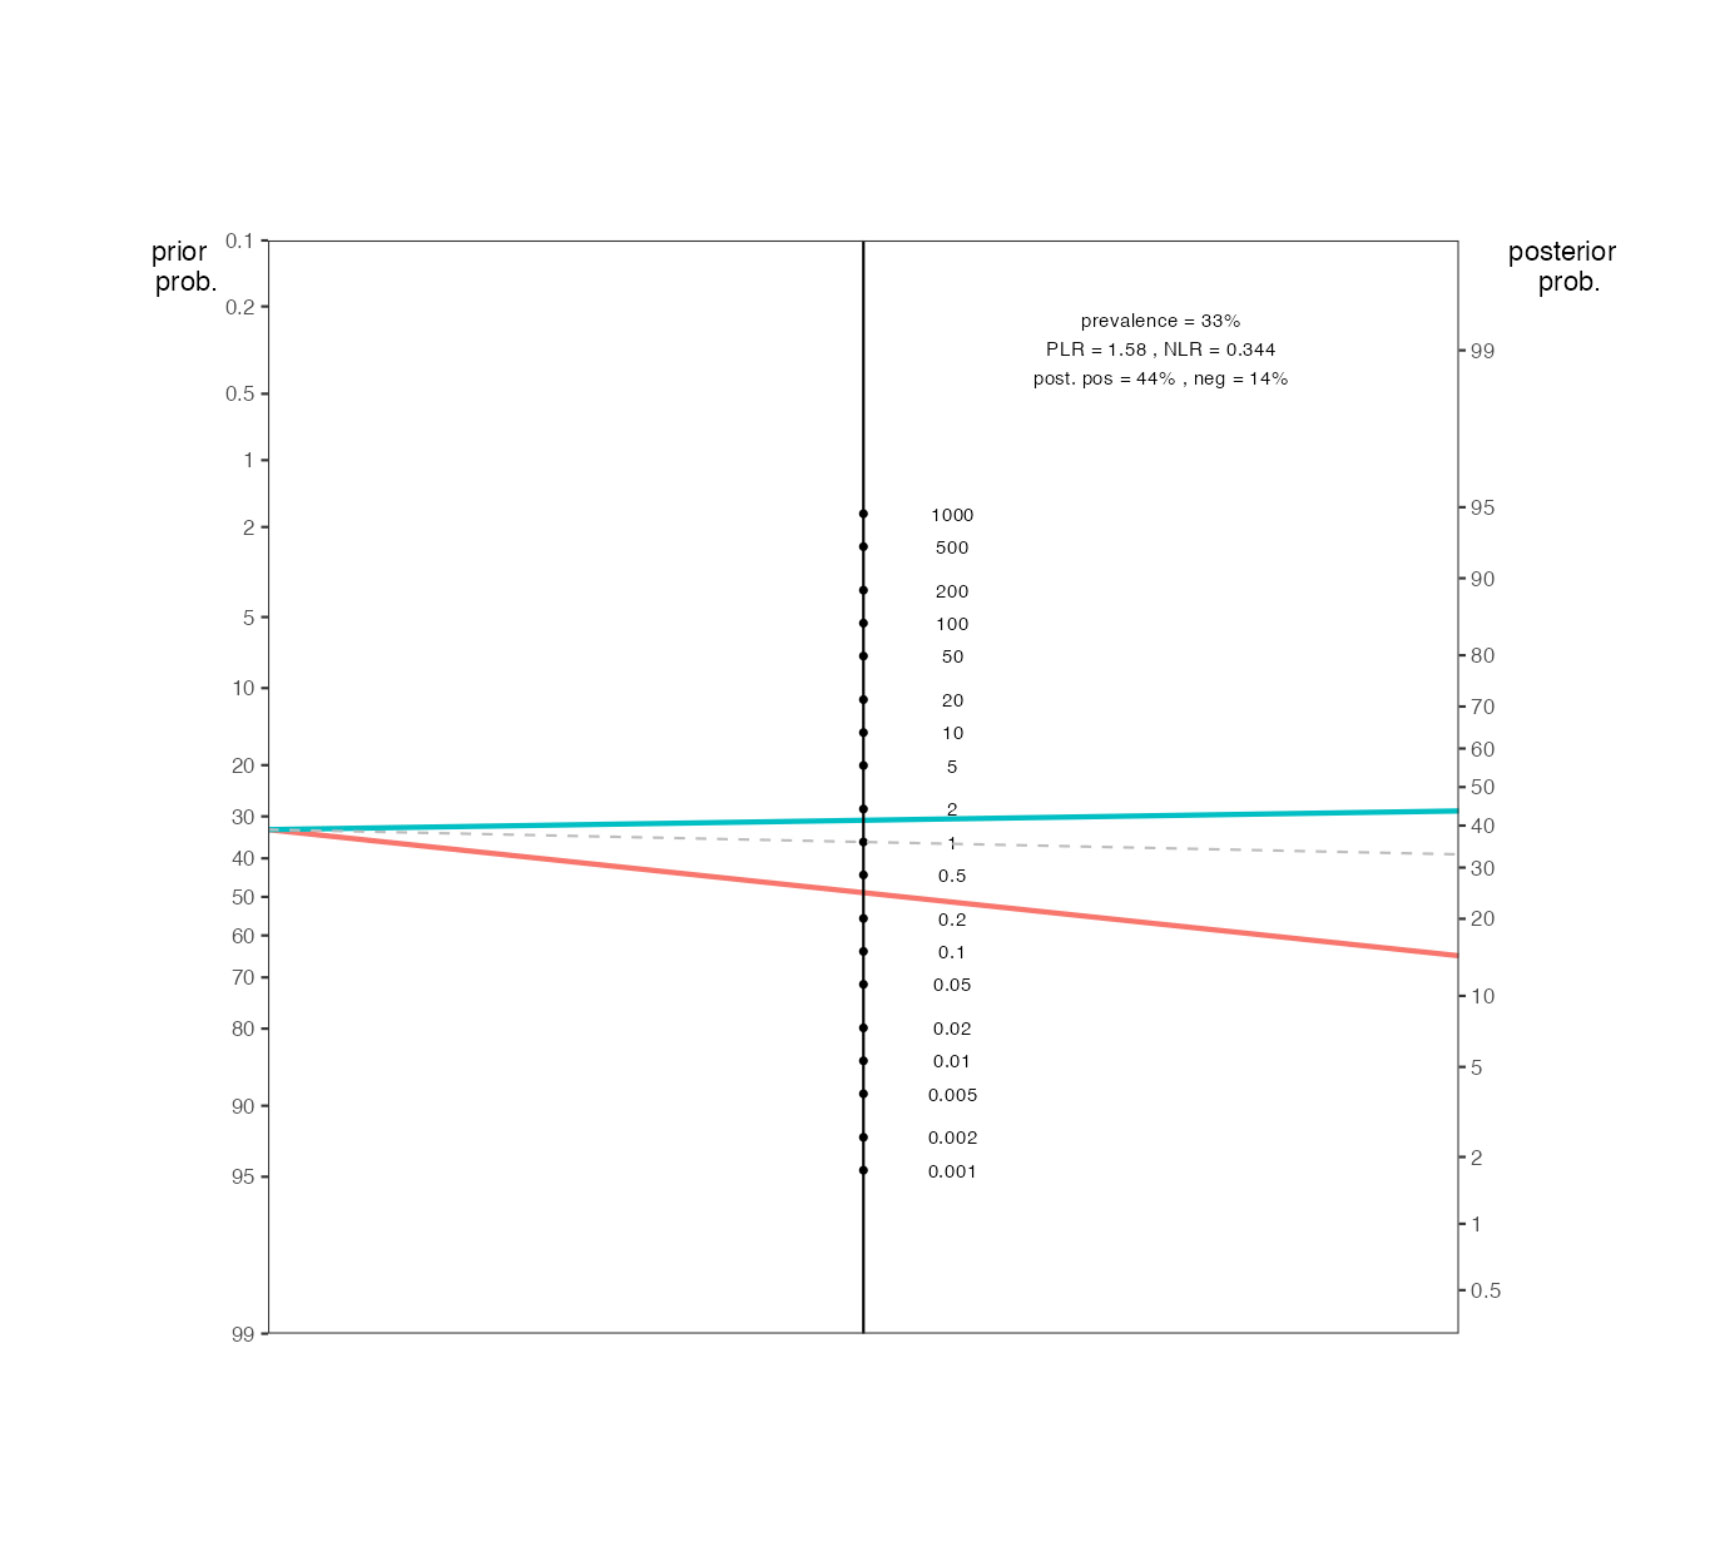 Figure 8. Fagan’s nomogram illustrating the diagnostic performance of the logistic regression model. The Fagan nomogram demonstrates the relationship between pre-test probability, likelihood ratios, and post-test probabilities for the index test. With a pre-test probability of 33% and likelihood ratios of LR⁺ = 1.58 and LR⁻ = 0.36, a positive result increases the post-test probability of bladder cancer to approximately 44%, whereas a negative result decreases it to about 15%. This pattern highlights the model’s ability to substantially reduce the probability of disease following a negative result, supporting its utility as a non-invasive rule-out tool for early bladder cancer detection.
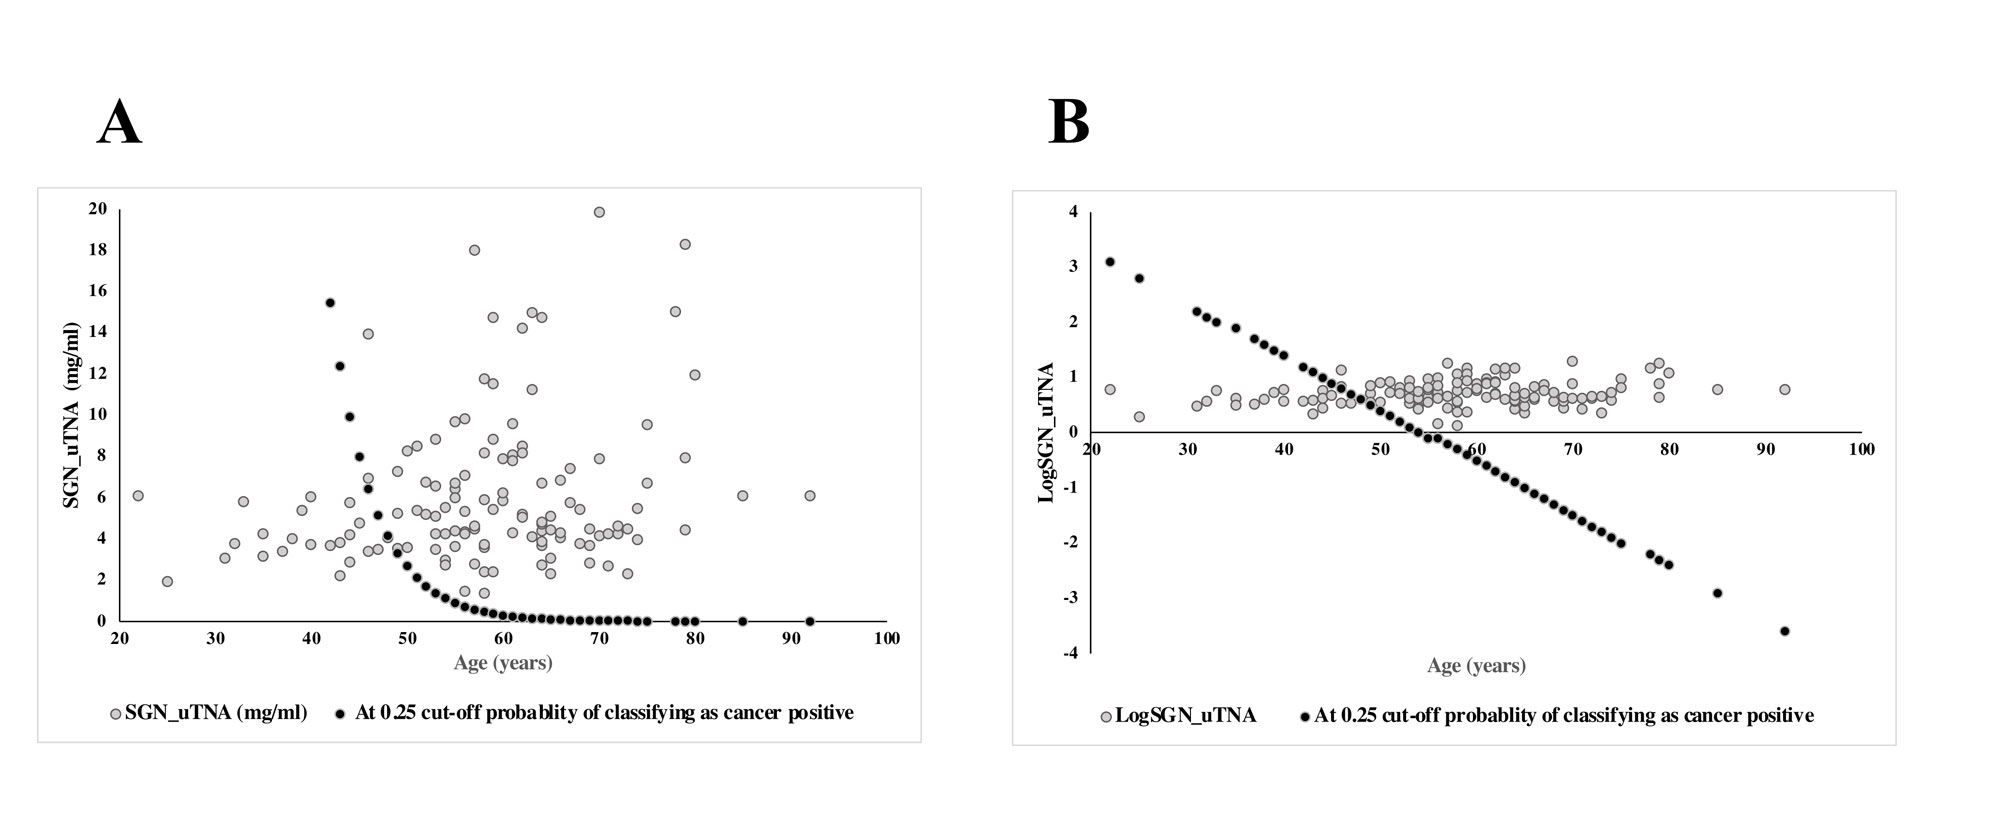 Figure 9. Logistic regression model–derived age-wise specific gravity-normalized urinary total nucleic acid threshold corresponding to a predicted probability of 0.25. The black curve represents the diagnostic cut-off beyond which individuals are classified as likely to have bladder cancer (p ≥ 0.25). (A) Raw SGN-uTNA (mg/mL). (B) Log₁₀-transformed SGN-uTNA values showing the model-derived dashed line corresponding to the probability threshold of p = 0.25, indicating the classification boundary for cancer detection.
Comparison with Previous Literature: Our results are concordant with multiple prior reports showing that urinary cell -free DNA (ucfDNA) or total urinary nucleic acid is increased in patients with bladder cancer relative to controls and may be clinically informative for detection and surveillance [3-8]. Recent reviews and primary studies highlight urine cfDNA as a promising source of tumor-derived nucleic acids for urothelial carcinoma detection [20,21]. Chang et al [4] and demonstrated that urinary cfDNA could serve as a useful non-invasive marker for detecting bladder malignancy, while Zancan et al [8] and Tse et al [5] confirmed similar trends using independent patient cohorts. The meta-analysis by Wang et al [6] encompassing multiple studies concluded that cfDNA in urine and plasma exhibits strong diagnostic potential for bladder cancer, with pooled sensitivity and specificity of 0.71 and 0.78, respectively. This sensitivity-oriented threshold resulted in modest specificity (0.47) (see Table 7), which necessarily increases the number of false-positive results and may lead to additional investigations. We acknowledge that this trade-off limits the stand-alone clinical utility of the assay. However, the intended role of SGN-uTNA in the present study is as an initial triage or rule-out test rather than a definitive diagnostic test. In this context, prioritizing sensitivity and minimizing false-negative results may be clinically preferable when the consequence of delayed recognition of UCB is potentially substantial. A positive SGN-uTNA result should therefore not be interpreted as diagnostic of UCB but should prompt appropriate confirmatory evaluation, such as cystoscopy, imaging, or a more specific urine-based molecular assay. Thus, the clinical value of the assay would depend on its use as an initial low-cost filter within a stepwise diagnostic pathway rather than as a replacement for definitive diagnostic evaluation. Nevertheless, such an approach is advantageous for screening purposes, as it minimizes the likelihood of missing true positive cases-an essential consideration for the early detection of cancer and consistent with our emphasis on achieving strong rule-out performance [22,23]. Where our study contributes methodologically is the routine normalization of total urinary nucleic acid concentration to urine specific gravity (USG). Urinary dilution is a major pre-analytic source of variability in urine biomarkers; prior work has shown that SG (or pre-acquisition SG normalisation) can outperform post-hoc corrections and offers a robust method to reduce dilutional bias across individuals and collection times [24]. Importantly, by normalizing uTNA to urine specific gravity, we addressed one of the key methodological challenges in urinary biomarker research - variability due to hydration and collection timing. Burton et al [11] demonstrated that specific-gravity normalization substantially improves reproducibility in urinary pteridine-based cancer biomarkers; our study extends this principle to cfNAs for the first time, providing proof-of-concept evidence that SG normalization enhances diagnostic consistency in urinary DNA assays. The use of UV absorbance at 260 nm for quick total nucleic acid quantification is a well-established biochemical method [10] and provides a low-cost, reagent-free approach that is attractive for screening settings, albeit with known limitations regarding contamination and lack of sequence specificity. Finally, molecular urine-based assays that target tumour-specific alterations (for example, Telomerase Reverse Transcriptase (TERT) promoter mutations) have shown high sensitivity and can detect tumours even years before clinical diagnosis; integrating such mutation-targeted assays with a simple quantitative SG-normalized screen would likely improve specificity while retaining the screening advantages of a low-cost assay [25].
Biological Plausibility and Interpretation: Elevated urinary cfNAs in bladder cancer are biologically plausible because tumour cells in the urothelium undergo frequent apoptosis, necrosis, and shedding into the urinary tract [5,9] These processes release nucleic acids directly into the urine which explains why urine is a rich matrix for tumour-derived nucleic acids and why cfDNA-based liquid biopsies frequently outperform plasma for urothelial cancers [21,6].
However, it is important to note that the UV260 spectrophotometric method used in this study measures total urinary nucleic-acid signal and does not specifically identify tumour-derived cfNA. The measured signal may include nucleic acids released from tumour cells as well as normal urothelial cells and other cellular sources. In addition, UV absorbance at 260 nm is not sequence-specific and may be influenced by other urinary substances or contaminants. Although sample dilution, blanking, and measurement procedures were standardized, these potential sources of non-specific absorbance cannot be completely excluded using UV spectrophotometry alone. Therefore, our findings should be interpreted as an association between SG-normalized total urinary nucleic-acid signal and UCB, rather than direct evidence of increased tumour-derived cfNA. Tumour-specific molecular assays will be required to confirm the origin and specificity of the urinary nucleic-acid signal. The observed elevation of urinary uTNAs in both low-grade and muscle-invasive tumours suggests that uTNA release occurs early in tumourigenesis. Interestingly, our data revealed slightly higher mean uTNA levels in low-grade compared with high-grade tumours, consistent with the hypothesis that early, non-invasive lesions may release proportionally more uTNAs due to higher rates of cellular turnover in superficial layers [7,8]. Conversely, advanced muscle-infiltrating cancers may retain nucleic acids within necrotic tissue compartments, resulting in lower urinary release relative to tumour mass. The combined influence of age and uTNA concentration in our logistic model reflects age-related genomic instability and cumulative carcinogen exposure, both established risk factors for bladder cancer [12,1,2]. This is consistent with reports that tumour-derived alterations (e.g., TERT promoter mutations) are detectable in urine prior to clinical diagnosis [25].
Clinical Implications: The present findings support the potential role of specific-gravity–normalized urinary uTNA as a simple, rapid, reagent-free and cost-effectively triage or preliminary rule-out tool for early detection of bladder cancer, particularly in resource-limited settings. The use of UV spectrophotometry (260 nm) allows high-throughput analysis at minimal cost, avoiding the complexity and expense of PCR-based assays. With its high sensitivity and excellent NPV, this method could be applied for initial triage in high-risk populations — such as older men with occupational exposures to aromatic amines or recurrent urinary symptoms — to prioritize candidates for confirmatory cystoscopy. Because a negative SGN-uTNA (at our chosen cut-off of 0.25) substantially reduces the pre-test probability of cancer in a urology clinic population (for example, from 33% to ~15% in our Fagan Nomogram, Figure 8), "this finding suggests that a negative result may reduce the estimated probability of UCB and could potentially assist triage when interpreted alongside clinical assessment and confirmatory testing pathways." Because the specificity was moderate, a positive SGN-uTNA result would need further tests, such as cystoscopy, imaging, or a specific urine-based molecular test. This may lead to some additional investigations, but this is an expected trade-off because our test is designed to prioritize sensitivity and reduce the chance of missing bladder cancer. Combining a broad, low-cost quantitative screen (SGN-uTNA) with a second-line targeted molecular assay (e.g., TERT or Fibroblast Growth Factor Receptor 3 (FGFR3) mutation testing) is a practical staged strategy: the first stage maximizes sensitivity and coverage, and the second stage increases specificity and provides molecular diagnostic information [25]. Furthermore, its complete non-invasiveness and rapid turnaround make it suitable for longitudinal surveillance in post-treatment follow-up, potentially reducing the frequency of invasive cystoscopic evaluations.
Strengths and limitations: Key strengths of our work include prospective enrolment with histopathological confirmation (gold standard), a relatively large sample size with many early-stage and low-grade tumours, internal four-fold cross-validation to assess generalizability, and the novel application of SG normalization to total urinary nucleic acids—an approach that reduces pre-analytic variability and is feasible in routine laboratory settings. The simplicity and speed of UV 260-nm measurement make the method scalable in resource-limited environments.
However, some limitations must be acknowledged. First, only male participants were included to minimize sex-based urinary variability; this restricts generalizability to women, who will be included in future validation phases. Second, the study was conducted at a single center with a predominantly North Indian population, warranting multicentric replication to ensure broader applicability. Third, the use of a case–control design with a healthy male reference group may result in higher estimates of diagnostic discrimination than would be observed in a clinically heterogeneous urological population. In the present study, healthy controls were specifically selected from individuals without urinary complaints or known urological disease, while the cancer cohort was restricted to treatment-naïve patients with histopathologically confirmed UCB and urine collected during haematuria-free episodes. This controlled design was intentional and enabled an initial assessment of the SGN-uTNA signal while minimizing potential biological and treatment-related confounding. However, the study was not designed to determine whether SGN-uTNA can distinguish UCB from benign urological conditions such as urinary tract infection, stones, benign prostatic hyperplasia, inflammation, or non-malignant haematuria. Therefore, the reported diagnostic performance should be interpreted as preliminary and should not be extrapolated directly to an unselected symptomatic urological population. Prospective validation using clinically relevant benign controls and consecutive patients presenting with suspected UCB will be required to establish real-world specificity and clinical utility.
Fourth, the specificity of the test was moderate at the selected probability cut-off, which means that some individuals without UCB may have a positive result and may require additional investigations. However, this was an expected trade-off of selecting a cut-off that prioritized sensitivity and reduced the likelihood of false-negative results. Therefore, SGN-uTNA should be considered an initial triage or rule-out test rather than a definitive diagnostic test, and positive results should be followed by appropriate confirmatory evaluation.Fifth, while total urinary nucleic-acid levels were quantified spectrophotometrically, this approach does not distinguish DNA from RNA or tumour-derived nucleic acids from non-tumour nucleic acids. In addition, UV260 absorbance is not sequence-specific and may be affected by other urinary substances or contaminants that absorb at or near 260 nm. Therefore, the measured signal should be considered a total urinary nucleic-acid signal rather than a tumour-specific cfNA measurement. Sixth, our spectrophotometric approach lacks mutation-level resolution; combining SGN-uTNA quantification with mutation-specific or methylation-based urine assays would be expected to improve specificity and clinical utility. Finally, although the combined logistic regression model achieved moderate discrimination, age was the stronger independent predictor in the present dataset. Formal comparison of the age-only model with the model incorporating both age and logSGN-uTNA showed no statistically significant incremental improvement after the addition of logSGN-uTNA. The age-only model achieved an AUC of 0.74, which remained unchanged after inclusion of logSGN-uTNA, and the nested likelihood-ratio comparison was not statistically significant (χ² = 1.91, df = 1, p = 0.167). These findings indicate that the independent incremental predictive contribution of logSGN-uTNA beyond age was limited in the present dataset. Future studies should therefore evaluate whether refinement of the assay and integration with tumour-specific molecular markers, such as mutation-specific or methylation-based urine assays, can provide additional predictive value and improve specificity [26-30]. External validation in independent and clinically heterogeneous cohorts remains necessary before clinical deployment.
The study protocol was approved by the Research and Ethics Committee of Swami Rama Himalayan University, and written informed consent was obtained from all participants (Approval letter ID: SRHU/HIMS/E-1/2023/50).
Author contributions
NG conceived and designed the study, served as the Principal Investigator, supervised the overall project, analyzed the data, and drafted the manuscript. NG and SA secured the funding for the study, with SA serving as Co-Investigator. SA also assisted with patient recruitment and collection of patient-related data. AS assisted with sample collection, spectrophotometric analysis of the samples, and generation of the raw data. All authors read and approved the final manuscript.
Competing interests
Dr. Neeraj Gupta is the named inventor on a patent application entitled “A Urinal Prototype for Cancer Screening by Quantitation of Native Nucleic Acids in Urine Using UV Spectroscopy” (Indian Patent Application No. 202211026749 A), which has been filed and published, with the applicant being Swami Rama Himalayan University. The patent relates conceptually to non-invasive urinary nucleic acid–based cancer screening.
Acknowledgments
The authors gratefully acknowledge the financial support provided by Swami Rama Himalayan University for this research. We also sincerely thank the Department of Biochemistry, Himalayan Institute of Medical Sciences, for providing the institutional support, facilities, and resources necessary for the successful completion of this study. We extend our heartfelt appreciation to our colleagues and all those who contributed to this project, particularly Dr. Shikhar Agarwal and Ms. Aarti Solanki, for their valuable assistance and support throughout the study.
Funding
This study was supported by an intramural research project grant from the Himalayan Institute of Medical Sciences, Swami Rama Himalayan University, Jolly Grant, Dehradun, Uttarakhand, India (Project ID: HIMS/RC/2023/153).
- Bray F, Laversanne M, Sung H, Ferlay J, Siegel RL, Soerjomataram I, Jemal A: Global cancer statistics 2022: GLOBOCAN estimates of incidence and mortality worldwide for 36 cancers in 185 countries. CA Cancer J Clin 2024, 74(3): 229-263.
- Ferlay J, Ervik M, Laversanne M, Colombet M, Mery L, Piñeros M, Znaor A, Soerjomataram I, Bray F: Global Cancer Observatory: Cancer Today. Lyon, France: International Agency for Research on Cancer, 2024. Available from: https://gco.iarc.who.int/today. Accessed September 19, 2025.
- Brisuda A, Pazourkova E, Soukup V, Horinek A, Hrbáček J, Capoun O, Svobodova I, Pospisilova S, Korabecna M, Mares J, et al.: Urinary cell-free DNA quantification as non-invasive biomarker in patients with bladder cancer. Urol Int 2016, 96(1): 25-31.
- Chang HW, Tsui KH, Shen LC, Huang HW, Wang SN, Chang PL: Urinary cell-free DNA as a potential tumor marker for bladder cancer. Int J Biol Markers 2007, 22(4): 287-294.
- Tse RTH, Zhao H, Wong CYP, Cheng CKL, Kong AWY, Peng Q, Chiu PKF, Ng CF, Teoh JYC: Urinary cell-free DNA in bladder cancer detection. Diagnostics 2021, 11(2): 306.
- Wang X-S, Zhao M-Q, Zhang L, Kong D-J, Ding X-Z, Hu X-C, Yang J-Q, Gao S-G: Cell-free DNA in blood and urine as a diagnostic tool for bladder cancer: a meta-analysis. Am J Transl Res 2018, 10(7): 1935-1948.
- Zancan M, Franceschini R, Mimmo C, Vianello M, Di Tonno F, Mazzariol C, Malossini G, Gion M: Free DNA in urine: a new marker for bladder cancer? Preliminary data. Int J Biol Markers 2005, 20(2): 134-136.
- Zancan M, Galdi F, Di Tonno F, Mazzariol C, Orlando C, Malentacchi F, Agostini M, Maran M, Del Bianco P, Fabricio ASC, et al.: Evaluation of cell-free DNA in urine as a marker for bladder cancer diagnosis. Int J Biol Markers 2009, 24(3): 147-155.
- Maas M, Todenhöfer T, Black PC: Urine biomarkers in bladder cancer—current status and future perspectives. Nat Rev Urol 2023, 20(10): 597-614.
- Gallagher SR: Quantitation of DNA and RNA with absorption and fluorescence spectroscopy. Curr Protoc Mol Biol 2004, 66: A.3D.1-A.3D.12.
- Burton C, Shi H, Ma Y: Normalization of urinary pteridines by urine specific gravity for early cancer detection. Clin Chim Acta 2014, 435: 42-47.
- Mau B, Johnson B, Hansel DE, McConkey DJ: The many faces of muscle-invasive bladder cancer: histopathological and molecular characterization. Semin Radiat Oncol 2023, 33(1): 1-11.
- Miller RC, Brindle E, Holman DJ, Shofer J, Klein NA, Soules MR, O’Connor KA: Comparison of specific gravity and creatinine for normalizing urinary reproductive hormone concentrations. Clin Chem 2004, 50(5): 924-932.
- Zheng Q, Yang R, Ni X, Yang S, Xiong L, Yan D, Xia L, Yuan J, Wang J, Jiao P, et al.: Accurate diagnosis and survival prediction of bladder cancer using deep learning on histological slides. Cancers (Basel) 2022, 14(23): 5807.
- Bossuyt PM, Reitsma JB, Bruns DE, Gatsonis CA, Glasziou PP, Irwig L, Lijmer JG, Moher D, Rennie D, de Vet HCW, et al.: STARD 2015: an updated list of essential items for reporting diagnostic accuracy studies. BMJ 2015, 351: h5527.
- JASP Team: JASP Version 0.19.3 [Computer software]. 2025.
- The jamovi project: jamovi (Version 2.6.26.0) [Computer software]. 2025. Available from: https://www.jamovi.org.
- Dean AG, Sullivan KM, Soe MM: OpenEpi: Open Source Epidemiologic Statistics for Public Health. 2013. Available from: www.OpenEpi.com.
- Assel M, Sjoberg D, Elders A, Wang X, Huo D, Botchway A, Delfino K, Fan Y, Zhao Z, Koyama T, et al.: Guidelines for reporting of statistics for clinical research in urology. Eur Urol 2019, 75(3): 358-367.
- Huang FF, Di XF, Bai MH: Analysis of urine cell-free DNA in bladder cancer diagnosis by emerging bioactive technologies and materials. Front Bioeng Biotechnol 2024, 12: 1458362.
- Salfer B, Li F, Wong DTW, Zhang L: Urinary cell-free DNA in liquid biopsy and cancer management. Clin Chem 2022, 68(12): 1493-1501.
- Obuchowski NA, Graham RJ, Baker ME, Powell KA: Ten criteria for effective screening: their application to multislice CT screening for pulmonary and colorectal cancers. AJR Am J Roentgenol 2001, 176(6): 1357-1362.
- Florkowski CM: Sensitivity, specificity, receiver-operating characteristic (ROC) curves and likelihood ratios: communicating the performance of diagnostic tests. Clin Biochem Rev 2008, 29(Suppl 1): S83-S87.
- Edmands WMB, Ferrari P, Scalbert A: Normalization to specific gravity prior to analysis improves information recovery from high resolution mass spectrometry metabolomic profiles of human urine. Anal Chem 2014, 86(21): 10925-10931.
- Hosen MI, Sheikh M, Zvereva M, Scelo G, Forey N, Durand G, Voegele C, Poustchi H, Khoshnia M, Roshandel G, et al.: Urinary TERT promoter mutations are detectable up to 10 years prior to clinical diagnosis of bladder cancer: evidence from the Golestan Cohort Study. EBioMedicine 2020, 53: 102643.
- Chauhan PS, Shiang A, Alahi I, Sundby RT, Feng W, Gungoren B, Nawaf C, Chen K, Babbra RK, Harris PK, et al.: Urine cell-free DNA multi-omics to detect MRD and predict survival in bladder cancer patients. NPJ Precis Oncol 2023, 7(1): 6.
- Vedeld HM, Pharo H, Sørbø AK, Brandt-Winge S, Five MB, Jeanmougin M, Guldberg P, Wahlqvist R, Lind GE: Distinct longitudinal patterns of urine tumor DNA in patients undergoing surveillance for bladder cancer. Mol Oncol 2024, 18(11): 2684-2695.
- Zhang R, Zang J, Xie F, Zhang Y, Wang Y, Jing Y, Zhang Y, Chen Z, Shahatiaili A, Cai MC, et al.: Urinary molecular pathology for patients with newly diagnosed urothelial bladder cancer. J Urol 2021, 206(4): 873-884.
- Dudley JC, Schroers-Martin J, Lazzareschi DV, Shi WY, Chen SB, Esfahani MS, Trivedi D, Chabon JJ, Chaudhuri AA, Stehr H, et al.: Detection and surveillance of bladder cancer using urine tumor DNA. Cancer Discov 2019, 9(4): 500-509.
- Cheng L, Zhang S, Wang M, Lopez-Beltran A: Biological and clinical perspectives of TERT promoter mutation detection on bladder cancer diagnosis and management. Hum Pathol 2023, 133: 56-75.
Annals of urologic oncology
p-ISSN: 2617-7765, e-ISSN: 2617-7773
 Copyright © Ann Urol Oncol. This work is licensed under a Creative Commons Attribution-NonCommercial-No Derivatives 4.0 International (CC BY-NC-ND 4.0) License.