
 Submit Manuscript
Research Article | Open Access
Molecular and Clinicopathological Correlates of Wild-Type KRAS Expression in Prostate Cancer
Henry O. Ebili1, Sebastian A. Omenai2, Uchenna S. Ezenkwa3, Ayotunde O. Ale4, Patrick A. Akintola1, Adesoji E. Adetona1, Chima U. Akunwata5, Mbwas I. Mashor6, Ifeanyichukwu D. Nwanji7, Oluwadamilare Iyapo8, Chinedu A. Ezekekwu9, John C. Akulue10, Ngozi Chidozie11
1Morbid Anatomy and Histopathology Department, Olabisi Onabanjo University, 1 Hospital Road, Sagamu, Ogun State, Nigeria.
2Department of Anatomical Pathology, Edo State University, Km 7 Okene-Benin Expressway, Iyamho Uzairue, Nigeria.
3Department of Anatomic Pathology, Federal University of Health Sciences, Azare, Bauchi State, Nigeria.
4Medicine Department, Olabisi Onabanjo University, 1 Hospital Road, Sagamu, Ogun State, Nigeria.
5Department of Haematology, University College Hospital, Queen Elizabeth Road, Mokola, Ibadan, Oyo State, Nigeria.
6Department of Morbid Anatomy, Bingham University, Jos Campus, Jos, Plateau State, Nigeria.
7Department of Pathology, University College Hospital Ibadan, Queen Elizabeth Road, Mokola, Ibadan, Oyo State, Nigeria.
8Department of Morbid Anatomy, Eko University of Medicine and Health Sciences, Ijanikin, Lagos, Nigeria.
9Bristol Haematology and Oncology Centre, University Hospitals Bristol and Weston NHS, 22 Horfield Rd, Bristol BS2 8ED, United Kingdom.
10Department of Haematology, Alex Ekwueme Federal University Teaching Hospital, Abakaliki, Ebonyi State, Nigeria.
11Acute Medical Unit, Basildon and Thurrock University Hospitals NHS Foundation Trust, Basildon, United Kingdom.
Correspondence: Henry O. Ebili (Morbid Anatomy and Histopathology Department, Olabisi Onabanjo University, 1 Hospital Road, Sagamu, Sagamu LGA, Ogun State, Nigeria; Email: ebili.henry@oouagoiwoye.edu.ng).
Annals of Urologic Oncology 2024, 7(3): 118-132. https://doi.org/10.32948/auo.2024.07.29
Received: 23 Jul 2024 | Accepted: 28 Jul 2024 | Published online: 31 Jul 2024
Methods The clinico-genomic data of two PCa cohorts were retrieved from the cancer genome databases. KRAS expression-based gene enrichment for cell proliferation, apoptosis, and epithelial-mesenchymal transition /invasion programmes, RAS activation, MAPK and PI3K signalling were sought using gene enrichment analyses, and validated with clinicopathologically relevant tumour biology signatures.
Results RAS activation and hallmark tumour biology pathways were enriched in KRAS-high PCa subsets. KRAS expression also demonstrated significant associations with Gleason score and ISUP prognostic grade groups, pathological tumour stage, overall TNM stage, and treatment outcomes, but not with age, pathological node and metastasis statuses. The study further demonstrated that wild-type KRAS expression was deregulated in PCa by a combination of copy number changes, epigenetic/altered transcription factor-expression and microRNA mechanisms.
Conclusion The relevance of KRAS expression to clinical PCa biology and therapy outcomes deserves further validation.
Keywords wild-type KRAS, enrichment analysis, hallmark tumour biology, prostate cancer
In this study we investigated the clinicopathological and biological correlates of KRAS expression in PCa. KRAS alterations, in the form of somatic mutations and gene amplification, are commonly found in carcinomas of the lung and digestive tract (pancreas, gastric, colon and rectum). KRAS alterations especially have therapeutic relevance in lung cancers in which they are targets of therapy [5], and in gastrointestinal tract cancers in which they are used as predictive biomarkers of anti-EGFR therapy [6-8]. Although the much-valued KRAS somatic mutations are rare in PCa [9-11], it has been demonstrated that breast, lung, gastric, colorectal and prostate cancer with wild-type KRAS displayed high RAS activation scores and exhibited upregulated RAS signalling, evidence that KRAS activation can exist in the absence of somatic KRAS gene mutations [12-14]. Interestingly, most of the studies of KRAS alterations in PCa has been performed on cell lines [15-23]. However, cell lines may not recapitulate all aspects of tumour biology of any cancer type, inasmuch as culture studies are usually limited to two to seven cell lines per study. Under in vitro conditions, the survival and propagation of specific cancer cell populations and certain cancer states are preferentially supported. Furthermore, it has been observed that additional genetic and epigenetic alterations are introduced in long-term cell cultures, thereby creating systematic differences between cell culture and patients’ tumour states [24-27]. For the above reasons, it is pertinent to investigate KRAS expression in clinical PCa to verify the findings from cell line studies. A few studies have shown upregulation of KRAS signalling pathway in a clinical cohort of primary and metastatic PCa cases [28]. However, the clinicopathological and biological relevance of wild-type KRAS expression have yet to be comprehensively interrogated in any clinical PCa cohort.
The paucity of studies that utilize clinical PCa for KRAS studies, and the curiosity of active wild-type KRAS signalling in cancer, form the rationale for this study.
The aim of this study is to investigate the biological and clinicopathological significance of wild-type KRAS expression in clinical cohorts of PCa. The study objectives are to determine (i) whether KRAS signalling is active in PCa in the absence of KRAS coding mutations, (ii) whether any relationships between wild-type KRAS expression and tumour biology indices (cellular proliferation, invasion and apoptosis, etc.) exist in clinical PCa, (iii) whether altered KRAS expression in the context of wild-type KRAS can confer specific clinicopathological characteristics on PCa, (iv) to define the mechanisms of KRAS deregulation in PCa. The study hypothesis is that wild-type KRAS signalling is active in clinical PCa cases, in which altered KRAS expression has clinicopathological, molecular and biological significances.
The study retrospectively analysed the clinicopathological and genomic data of two PCa cohorts, TCGA Firehose [29, 30] and the DKFZ, (or, German Cancer Research Centre) PCa cohorts [31]. All the clinicopathological and genomic data were retrieved from the Genome Data Commons and cBioPortal for Cancer Genomics databases. The mRNA and miRNA quantification were accomplished with RNASeq and miRNASeq, respectively, while methylation data was obtained by methylation array on the Illumina Human Methylation 450 platform. The masked copy number segment data was generated using the Affymetrix SNP 6.0 genotyping array.
Online analyses of KRAS expression identified only about 0.3%-0.4% of PCa cases which harboured somatic mutations in KRAS in both cohorts [29, 30]. These cases were excluded from this study. Furthermore, while the gene expression dataset of the TCGA PCa cohort contained 60660 records, the DFKZ cohort had 20882. TCGA cohort comprised 500 primary PCa cases with clinicopathological (including prognostic and therapy outcome), RNASeq, chromosomal copy number segment, methylation, and somatic mutation data. The following amount of data was available for this cohort: clinicopathological (between 393 and 497 of the 500 cases for each clinicopathological indices; Table 1); mRNA expression (498/500 cases); chromosomal copy number segment (497/500 cases); methylation (between 322 and 498 of 500 cases for individual methylation loci); microRNA expression (498/500 cases) data. The DKFZ cohort included 118 PCa cases with clinicopathological (including biochemical recurrence post-therapy), and mRNA expression data. Data was available for clinicopathological features (93 to 95 of 118 cases with RNASeq data), and RNASeq (118/118 cases).
Bioinformatics analyses
Linux-based codes and scripts were written in the Window-based Ubuntu 20.04 environment in order to retrieved the data of interest from the downloaded materials. Linux-based scripts were also used to prepare gene expression datasets (in txt and gct formats) as per Gene Set Enrichment Analyses (GSEA) [32-34], and DeSeq2 Gene Ontology Enrichment Analyses requirements [35, 36], while the phenotype and derivative gene set files (see below) were prepared in Excel spreadsheet and converted to cls and grp files, respectively.
Study approach
KRAS expression for either PCa cohorts was dichotomised into low and high KRAS expression groups using the median expression values as the threshold. This categorization was applied to the GSEA, and to subsequent statistical analyses on SPSS. To determine whether wild-type KRAS signalling is active in PCa, we first explored the differential up-regulation of biological pathways (cell proliferation signalling: cell cycle, KRAS, MAPK, PI3K-AKT-MTOR, E2F and G2M checkpoint; tumour invasion signalling: TGFB and the epithelial-mesenchymal transition (EMT) signalling; and Apoptosis) between KRAS-high and KRAS-low cases in the TCGA PCa cohort by using the Molecular Signature Database (MSigDB) Hallmark (KRAS, PI3K-AKT-MTOR, and G2M checkpoint, TGFB, EMT, and Apoptosis) and KEGG (cell cycle and MAPK signalling) pathway gene sets [32-34]. Furthermore, we applied the RAS activation gene set described by Barbie et al [37] to the TCGA PCa cohort to confirm KRAS activation. Then, we validated the wild-type KRAS activation in the DFKZ cohort. To achieve the aforementioned validation, gene sets were created from the core enrichment set obtained from the TCGA dataset analyses and used to examine the DFKZ expression dataset, as per MSigDB recommendations, and to obtain core enrichment genes sets that were common to or shared by both PCa cohorts.
Gene Ontology (GO) Enrichment Analysis (https://www.geneontology.org/) [35, 36] was used to confirm the biological processes subserved by the genes in the common core enrichment genes sets. Furthermore, to confirm the biological relevancies of the GSEA results to the cohorts, we generated index scores for all the pathways by using the geometric means [38, 39] of the expression values of the enriched genes in the shared gene sets after filtering out the genes that are duplicated in the shared core enrichment gene sets (see Supplementary Materials 1: Core Enrichment Genes). The generated index scores were then validated by clinicopathological and prognostic features of the PCa cohorts. Direct correlation of KRAS expression with clinicopathological features such as age, race/ethnicity, pathological tumour, node and metastases statuses, overall tumour stage, Gleason score, prognostic grade groups, treatment outcomes, and follow-up (overall and disease-free survival) profiles was also sought in both the TCGA and DFKZ cohorts. Also, correlations between KRAS expression and the expression of androgen deprivation therapy (ADT)-resistance genes, AR (androgen receptor), NR3C1 (glucocorticoid receptor, GCR), and NR3C2 (mineralocorticoid receptor, MLR) [40-44] were sought in both cohorts. The mechanisms of altered KRAS expression – including copy number alterations, promoter methylation/altered transcription factor expression, and miRNA deregulation – were also investigated in the TCGA PCa cohort. For the miRNA deregulation analyses, differential enrichment of miRNA gene expression was sought in the TCGA cohort using DeSeq2 module in the GenePattern computing environment (https://cloud.genepattern.org/) [45]. A list of KRAS-relevant miRNA was retrieved from miRTarBase (https://mirtarbase.cuhk.edu.cn/~miRTarBase/miRTarBase_2022/php/) [46] and used to compare the results of the miRNA gene enrichment analysis. See Supplementary Materials 2: MirTbase KRAS_targeting miRNAs. Furthermore, transcription factors which have been experimentally demonstrated to bind to KRAS promoter regions were retrieved from TF2DNA_DB (https://www.fiserlab.org/tf2dna_db/search_genes.html) [47]; their expression values were incorporated into correlation and regression analyses to test their relationships with KRAS expression, and infer their roles in the deregulation of wild-type KRAS expression in PCa.
Statistical analyses
Gene set enrichment analyses were performed with permutations set to 1000, and by using gene-set permutation type, weighted enrichment statistics, and maximum and mini-mum gene-set sizes of 500 and 15, respectively. The nominal P value and false discovery rate (FDR) threshold were both set at 0.05 (or 5%). The clinicopathological and genomic data of interest were output in Excel spreadsheet from the Ubuntu environment and then input into SPSS version 29. Chi square (or Fisher) test was used to define associations between categorical variables, while bivariate correlative analysis was used to test the correlations between continuous variable. Independent Sample, Median k-sample and one-way ANOVA tests were used to measure the mean or median differences of continuous variables between discrete groups. Multiple linear regression analysis was used to predict the relationship between KRAS expression and the established mechanisms of altered gene expression (KRAS copy number alteration, KRAS promoter methylation, altered transcription factor expression and KRAS-specific miRNA expression patterns). Kaplan Meier and Cox regression analyses were used to define the prognostic significance of the generated tumour biology signatures and of KRAS expression. A P value of <0.05 was used as the threshold for significant test while the Benjamini-Hochberg correction was used to correct for multiple testing at an FDR of 0.05.
|
Table 1. Clinicopathological features of KRAS expression in TGCA and DFKZ prostate cancer cohorts (one-way ANOVA) (KRAS Expression). |
|||||||||
|
|
Clinicopathological Features |
N |
Mean |
Std. Deviation |
95% Confidence Interval |
F |
Adjusted P |
||
|
Lower Bound |
Upper Bound |
||||||||
|
TCGA Cohort |
Age at Diagnosis |
60 years and below |
223 |
5.619 |
2.228 |
5.325 |
5.913 |
0.143 |
0.705 |
|
61 years and above |
274 |
5.697 |
2.352 |
5.417 |
5.977 |
|
|
||
|
Total |
497 |
5.662 |
2.295 |
5.460 |
5.864 |
|
|
||
|
|
|
|
|
|
|
|
|
|
|
|
Race/Ethnicity |
American Indian |
1 |
4.857 |
|
|
|
3.323 |
0.031 |
|
|
Asian |
12 |
7.240 |
3.505 |
5.013 |
9.466 |
|
|
||
|
Black |
57 |
6.191 |
2.630 |
5.493 |
6.889 |
|
|
||
|
White |
412 |
5.548 |
2.185 |
5.337 |
5.760 |
|
|
||
|
Total |
482 |
5.665 |
2.296 |
5.459 |
5.870 |
|
|
||
|
|
|
|
|
|
|
|
|
|
|
|
Gleason Score |
Low Gleason score |
292 |
5.317 |
2.151 |
5.069 |
5.565 |
16.464 |
<0.001 |
|
|
High Gleason score |
205 |
6.153 |
2.409 |
5.821 |
6.485 |
|
|
||
|
Total |
497 |
5.662 |
2.295 |
5.460 |
5.864 |
|
|
||
|
|
|
|
|
|
|
|
|
|
|
|
ISUP* Prognostic Grade Group |
Groups 1 and 2 |
190 |
5.241 |
1.821 |
4.981 |
5.502 |
10.531 |
0.003 |
|
|
Groups 3 to 5 |
307 |
5.922 |
2.513 |
5.640 |
6.204 |
|
|
||
|
Total |
497 |
5.662 |
2.295 |
5.460 |
5.864 |
|
|
||
|
|
|
|
|
|
|
|
|
|
|
|
Pathological Tumour Stage |
pT2 |
181 |
5.107 |
1.775 |
4.846 |
5.367 |
11.964 |
<0.001 |
|
|
pT3 |
268 |
6.029 |
2.541 |
5.724 |
6.335 |
|
|
||
|
pT4 |
10 |
7.469 |
2.864 |
5.420 |
9.518 |
|
|
||
|
Total |
459 |
5.697 |
2.331 |
5.483 |
5.911 |
|
|
||
|
|
|
|
|
|
|
|
|
|
|
|
Lymph Node status |
Lymph node negative |
320 |
5.729 |
2.284 |
5.478 |
5.980 |
2.101 |
0.197 |
|
|
Lymph node positive |
76 |
6.159 |
2.481 |
5.592 |
6.726 |
|
|
||
|
Total |
396 |
5.812 |
2.326 |
5.582 |
6.041 |
|
|
||
|
|
|
|
|
|
|
|
|
|
|
|
Metastasis Status |
No distant metastasis |
455 |
5.669 |
2.282 |
5.459 |
5.879 |
0.336 |
0.643 |
|
|
Distant metastasis present |
3 |
6.435 |
1.699 |
2.215 |
10.655 |
|
|
||
|
Total |
458 |
5.674 |
2.278 |
5.465 |
5.883 |
|
|
||
|
|
|
|
|
|
|
|
|
|
|
|
Overall stage (TNM) |
Localised Disease |
135 |
5.335 |
1.852 |
5.020 |
5.650 |
8.923 |
0.005 |
|
|
Advanced Disease |
258 |
6.068 |
2.515 |
5.759 |
6.376 |
|
|
||
|
Total |
393 |
5.816 |
2.332 |
5.585 |
6.047 |
|
|
||
|
|
|
||||||||
|
DFKZ Cohort |
Age at Diagnosis |
32-36 years |
1 |
4.301 |
- |
- |
- |
0.228 |
0.877 |
|
37-41 years |
4 |
5.709 |
2.609 |
1.558 |
9.861 |
|
|
||
|
42-46 years |
32 |
5.861 |
2.623 |
4.915 |
6.806 |
|
|
||
|
47 - 52 years |
58 |
6.245 |
3.442 |
5.340 |
7.150 |
|
|
||
|
Total |
95 |
6.073 |
3.121 |
5.437 |
6.708 |
|
|
||
|
|
|
|
|
|
|
|
|
|
|
|
Pathological Tumour Stage |
pT2 |
62 |
5.539 |
2.298 |
4.955 |
6.122 |
4.534 |
0.045 |
|
|
pT3 and pT4 |
31 |
6.872 |
3.721 |
5.507 |
8.237 |
|
|
||
|
Total |
93 |
5.983 |
2.901 |
5.386 |
6.581 |
|
|
||
|
|
|
|
|
|
|
|
|
|
|
|
Gleason Score (primary pattern) |
Gleason pattern 3 |
70 |
5.464 |
2.187 |
4.943 |
5.986 |
7.478 |
0.005 |
|
|
Gleason pattern 4 |
18 |
8.455 |
4.826 |
6.055 |
10.854 |
|
|
||
|
Gleason pattern 5 |
7 |
6.029 |
3.205 |
3.066 |
8.993 |
|
|
||
|
Total |
95 |
6.073 |
3.121 |
5.437 |
6.708 |
|
|
||
|
|
|
|
|
|
|
|
|
|
|
|
ISUP Grade Group |
Groups I and II |
70 |
5.464 |
2.187 |
4.943 |
5.986 |
11.196 |
0.003 |
|
|
Groups III-V |
25 |
7.776 |
4.505 |
5.916 |
9.635 |
|
|
||
|
Total |
95 |
6.073 |
3.121 |
5.437 |
6.708 |
|
|
||
|
|
|
|
|
|
|
|
|
|
|
|
Pre-operative Prostate-Specific Antigen |
Low PSA |
47 |
5.325 |
2.925 |
4.466 |
6.183 |
5.115 |
0.044 |
|
|
High PSA |
46 |
6.656 |
2.747 |
5.840 |
7.472 |
|
|
||
|
Total |
93 |
5.983 |
2.901 |
5.386 |
6.581 |
|
|
||
TCGA and the DFKZ cohorts were probed for KRAS activation using GSEA. The results showed that KRAS signalling was upregulated in the KRAS-high relative to KRAS-low subsets in both PCa cohorts (Supplementary Materials 2: GSEA Results). Furthermore, differential enrichment of the Barbie et al RAS activation gene set was observed in the KRAS-high subsets of both PCa cohorts (Figure 1), thereby validating the results obtained with the KRAS signalling pathway enrichment analysis.
Differential expression of tumour biology pathways in KRAS expression groups
Gene set enrichment analyses showed differential enrichment of tumour biology pathways between the KRAS-high and KRAS-low groups in both PCa cohorts. Differential enrichment was observed in all the Hallmark and KEGG gene sets that were interrogated (Figure 2 and Supplementary Materials 2: GSEA_Results), at nominal P value and false discovery rate (FDR) of less than 0.05. GO Enrichment Analysis confirmed that the core enrichment genes common to both PCa expression datasets included established members of the following pathways and biological functions: G2M transition genes (CHEK1, RAD21, HUS1, BARD1, AURKA, FBXO5, CENPF, CDC7, CDKN3, STIL, CUL3, CUL4A, EZH2, PAFAH1B1, BRCA2), regulation of cell cycles (RACGAP1, STIL, TPX2, SMARCC1, ATRX, TTK, PRPF4B, BRCA2, EZH2, CDC27, KIF15, HNRNPU, AURKA, MAD2L1, SMC4, KIF11, FBXO5, CENPE, CHEK1, DBF4, PAFAH1B1, PLK4, BUB3, RAD21, BUB1, CENPF, SMC2, CUL3, DR1, CDC7), regulation of cell population proliferation (SMARCC1, TTK, BRCA2, EZH2, HNRNPU, PDS5B, FBXO5, CHEK1, HIF1A, E2F3, SQLE, CUL3, CDC7, CDKN3, NOLC1, SS18, KIF20B, CCNA2, CUL4A), cell cycle and G1/S transition of mitotic cycle (RB1, RBL1, CDK2, CDKN1B, CCNH, CDK1, CDK7, CDK6, TFDP1, CCNB1), TGFB signalling genes (BMPR2, MAP3K7, BMPR1A, TGFBR1, SMURF2, ACVR1), PI3K signalling pathway (PDK1, PTEN, GSK3B), RAS and EGF signalling pathways (PAK2, SOS2, MAP3K1, SOS1, MAPK14, MAPK1, CDC42, RPS6KA6, MAP2K1, NRAS, RPS6KA3, PAK1, ATF2, BRAF, MAPK9, RAF1, MAPK8, MAP2K6, MAP2K4, AKT3), MAPK signalling (RRAS2, SOS2, MAP3K1, MAP3K5, SOS1, NF1, MAPK14, MAPK1, NRAS, RASA1, RASA2, BRAF, MAPK9, MAP3K2, RAF1, MAPK8, MAP2K6, MAP2K4) and MAPK pathway-interacting genes (PAK2, CRK, CHUK, ATF2, TRAF6, PAK1), Apoptosis signalling (BCL10, CASP3, XIAP, FAS, CASP8, CASP2, CYLD, MCL1, BCL2L11, CASP7, DAP3, BIRC3), and extracellular matrix pathways (ITGAV, PFN2, PLOD2, ECM2, SGCB, TPM4, SPOCK1, GREM1, MATN3, TNFRSF11B, NT5E, ITGB1, PRRX1, CADM1, ITGA2, EDIL3, COL11A1, COL5A2, INHBA, VCAN, VEGFC, SNTB1, LAMC1, MFAP5, ADAM12, BASP1, TGFBR3, POSTN, DCN, SPP1, VCAM1, COL3A1, CTHRC1, LUM, SERPINE2, COL4A1, IGFBP3) and EMT pathway genes (CDH6, WNT5A, ID2, NOTCH2) (Supplementary Materials 2: GO_Analysis).
Validation of GSEA results using tumour biology signatures and clinicopathological indices
The Cell Cycle, Apoptosis and EMT/invasion index scores for the PCa cohorts were generated by calculating the geometric means of the expression values of the core enrichment gene sets common to both PCa cohorts (Hallmark G2M_checkpoint, Apoptosis and EMT gene sets; KRAS expression was excluded in the generation of the tumour biology signatures). One-way ANOVA test demonstrated that the KRAS expression-based tumour biology signatures in the TCGA PCa cohort showed significant correlation with Gleason score (Cell Cycle, EMT/invasion and Apoptosis signatures), ISUP prognostic grade group (Cell Cycle and EMT/invasion signatures), pathological T stage (Cell Cycle, EMT/invasion and Apoptosis signatures), pathological metastasis stage (EMT/invasion signatures), TNM stage (Cell Cycle and EMT/invasion signatures), biochemical recurrence (Cell Cycle signature), and treatment outcomes (Cell Cycle, EMT/invasion and Apoptosis signatures). Cox regression analysis demonstrated that the tumour biological processes predicted disease-free survival (Cell Cycle and Apoptosis signatures), and 10 years overall survival (Cell Cycle and Apoptosis signatures) (see Figure 3 and Supplementary Materials 2: Signature_Validation.TCGA). In the DFKZ cohort, significant correlation was found between the tumour biology signatures and pathological T stage (Cell Cycle, EMT/Invasion and Apoptosis signatures), Gleason score (Cell Cycle and EMT/Invasion signatures), ISUP Grade Group (Cell Cycle and EMT/Invasion signatures), and pre-operative prostate-Specific Antigen levels (Cell Cycle and EMT/Invasive signatures) (see Figure 3 and Supplementary Materials 2: Signature_Validation.DFKZ). This is evidence that the KRAS expression-based differential gene set enrichment observed with the GSEA have biological relevancies in both PCa cohorts. It also validated our hypothesis of an active wild-type KRAS signalling in PCa.
Clinicopathological correlates of wild-type KRAS expression
Having demonstrated wild-type KRAS activation in subsets of PCa expressing high KRAS mRNA, we sought to directly examine the clinicopathological significance of KRAS expression in PCa. The relationships between KRAS expression and clinicopathological indices such as age, race/ethnicity, pathological tumour, node and metastases statuses, overall tumour stage, Gleason score, prognostic grade groups, and follow-up (overall survival and disease-free) profiles were sought in the PCa cohorts. One-way ANOVA tests showed that KRAS expression showed significant relationships with race/ethnicity, pathological tumour stage, overall tumour stage, Gleason score, and Gleason prognostic grade groups (Table 1). However, no significant relationships were found for age, pathological node and metastasis statuses. Furthermore, no relationships were found between KRAS expression and disease-free or overall survival.
Therapy resistance correlates of wild-type KRAS expression
In both PCa cohorts a direct relationship was observed between KRAS signalling and ex-pression of AR, GCR and MLR. High levels of expression of these therapy resistance-associated genes were found in PCa cases with high KRAS expression compared to cases with low KRAS expression (Figure 4). The results suggested that KRAS signalling may play a role in determining therapeutic outcome through its interactions with these therapy resistance-associated genes. Next, we compared the primary therapeutic out-comes (TCGA cohort) and biochemical recurrences (TCGA and DFKZ cohorts) between cases with high and low KRAS expression. Chi square test showed that patients with high KRAS expression significantly exhibited less than complete outcomes compared to those with low KRAS expression in the TCGA cohort (Figure 5A). However, binary logistic regression analyses showed that the relationship between KRAS expression levels and therapeutic outcome was not independent of AR expression in the TCGA cohort (data not shown). Moreover, Kaplan-Meier test showed that no significant correlation exists be-tween time to biochemical recurrence and KRAS or AR expression levels, even though the pre-operative pSA levels were significantly higher in the DFKZ patients with high KRAS expression (Figure 5B & 5C, and Table 1).
Deregulation of KRAS expression in PCa
The TCGA PCa cohort was used to investigate the deregulation of KRAS expression in PCa as it has comprehensive data on mRNA expression, copy number segment, methylation and miRNA expression. KRAS copy number alteration (CNA) status was derived from the copy number segment data by using the segment mean thresholds of -0.3 and 0.3. Based on these thresholds there were 38/498, 456/498 and 6/498 losses/deletions, wild-types/neutrals and gains/amplifications, respectively. There was a significant KRAS copy number-expression correlation (one-way ANOVA test: F=25.181, degree of freedom=2, P<0.001, Figure 6). Furthermore, we investigated the role of KRAS-targeting transcription factors in the deregulation of KRAS expression in PCa using known KRAS-targeting transcription factors obtained via analysis from the transcription factor database TF2DNA_DB. Seven transcription factors, including NKX3-1, HMGA1, NHLH1, SMAD2, MECP2, ZNF219, and ESRRB, were identified from TF2DNA_DB; their expression levels were incorporated into a bivariate analysis which revealed that the expression of 4/7 of the transcription factors displayed correlations with KRAS expression (MECP2: R=0.290, P<0.001; NKX3-1: R=0.325, P<0.001; SMAD2: R=0.395, P<0.001; ZNF219: R= -0.224, P<0.001). Differential Expression Analysis using DeSeq2 identified the top 40 differentially expressed miRNAs between the KRAS-high and KRAS-low PCa subsets. Bivariate correlation analysis demonstrated that 28/40 of the miRNA exhibited direct and indirect correlations with KRAS expression (see Supplementary Materials 2: MicroRNA Enrichment Analyses and MicroRNA-KRAS Correlation). However, only four of the miRNAs matched the list of KRAS-relevant miRNAs retrieved from the miRTarBase database (see Supplementary Materials 2: MirTbase KRAS_targeting miRNAs). Furthermore, bivariate correlation analysis showed that 7/28 KRAS methylation loci, cg06891455, cg10569807, cg13085893, cg17197538, cg25763538, cg27174311, cg27550152, correlated with KRAS expression (see Supplementary Materials 2: KRAS Methylation-Expression).
The KRAS copy number data, beta and expression values, respectively, of the positive KRAS methylation loci and the identified transcription factors and miRNAs from the bi-variate analyses above were incorporated into a multiple linear regression to test whether they independently predict KRAS expression. The analysis identified MIR30C-1 (P=0.003), KRAS Copy Number Alterations (P<0.001), MIR4664 (P<0.001), MIRLET7A3 (P=0.040), MIR5001 (P=0.027), MIR1224 (P=0.024), SMAD2 (P<0.001), NKX3-1 (P<0.001), MECP2 (P=0.001), ZNF219 (P<0.001) as independent predictors of KRAS expression in the regression model (F=26.66, R2=0.383, P<0.001). The methylation loci were also significant predictors of KRAS expression in the regression analysis (cg17197538, P=0.041 and cg25763538, P=0.002), but in the absence of the transcription factors. This is evidence that the transcription factors exhibited collinearity with methylation loci, and thus may bind at those specific loci. Overall, the results showed that KRAS expression in PCa is deregulated by copy number changes, miRNA and epigenetic/altered transcription factor-expression mechanisms.
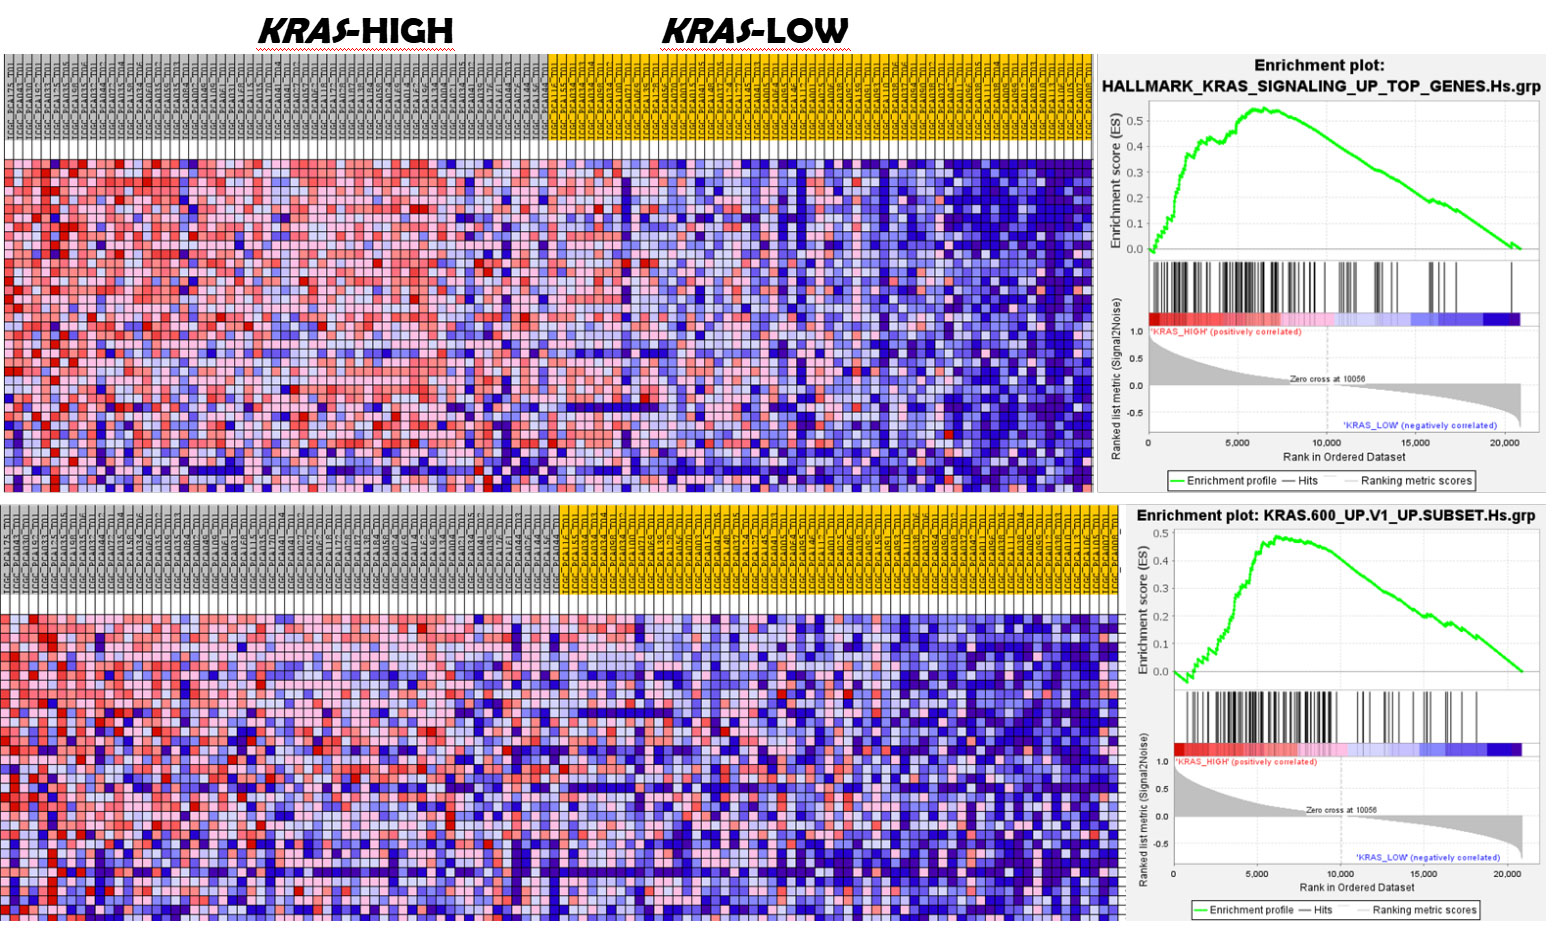 Figure 1. GSEA shows enrichment of KRAS signalling in KRAS-high prostate cancer subset. The upper panel displays enrichment of the MSigDB hallmark KRAS signalling pathway in the KRAS-high subset of the prostate cancer subsets. The lower panel shows enrichment of the signature of oncogenic KRAS-driven cancers. (GSEA for the DFKZ cohort shown here).
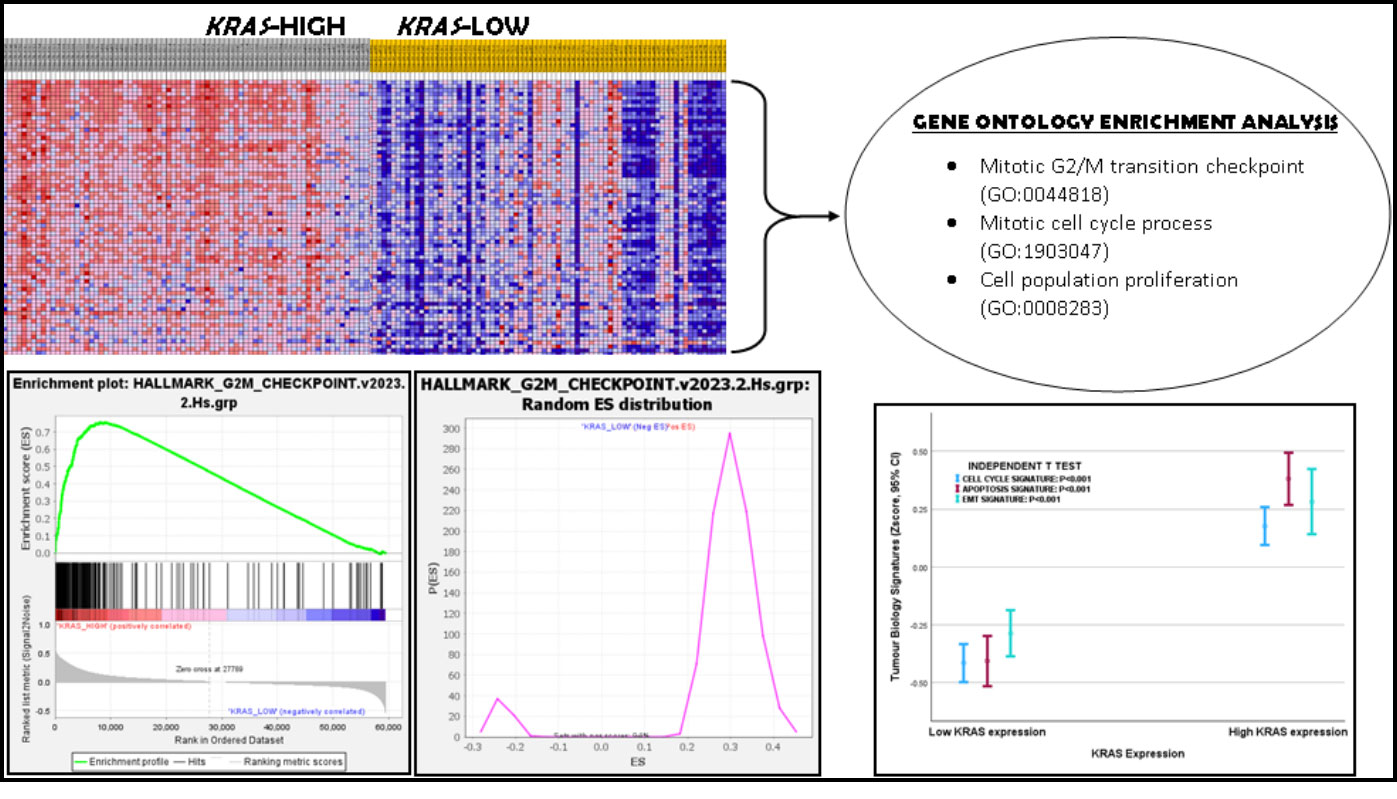 Figure 2. Gene Set Enrichment Analysis showed enrichment of G2M checkpoint gene set in KRAS-high prostate cancer. Gene Ontology Enrichment Analysis confirmed that G2M checkpoint, mitotic cell cycle process and cell population proliferation processes, among many others, were enriched in the KRAS-high subset of prostate cancer. The Error Bar graph shows that the Cell cycle, Apoptosis, Apoptosis and EMT/Invasion Signatures were relatively higher in the KRAS-high prostate cancer subset.
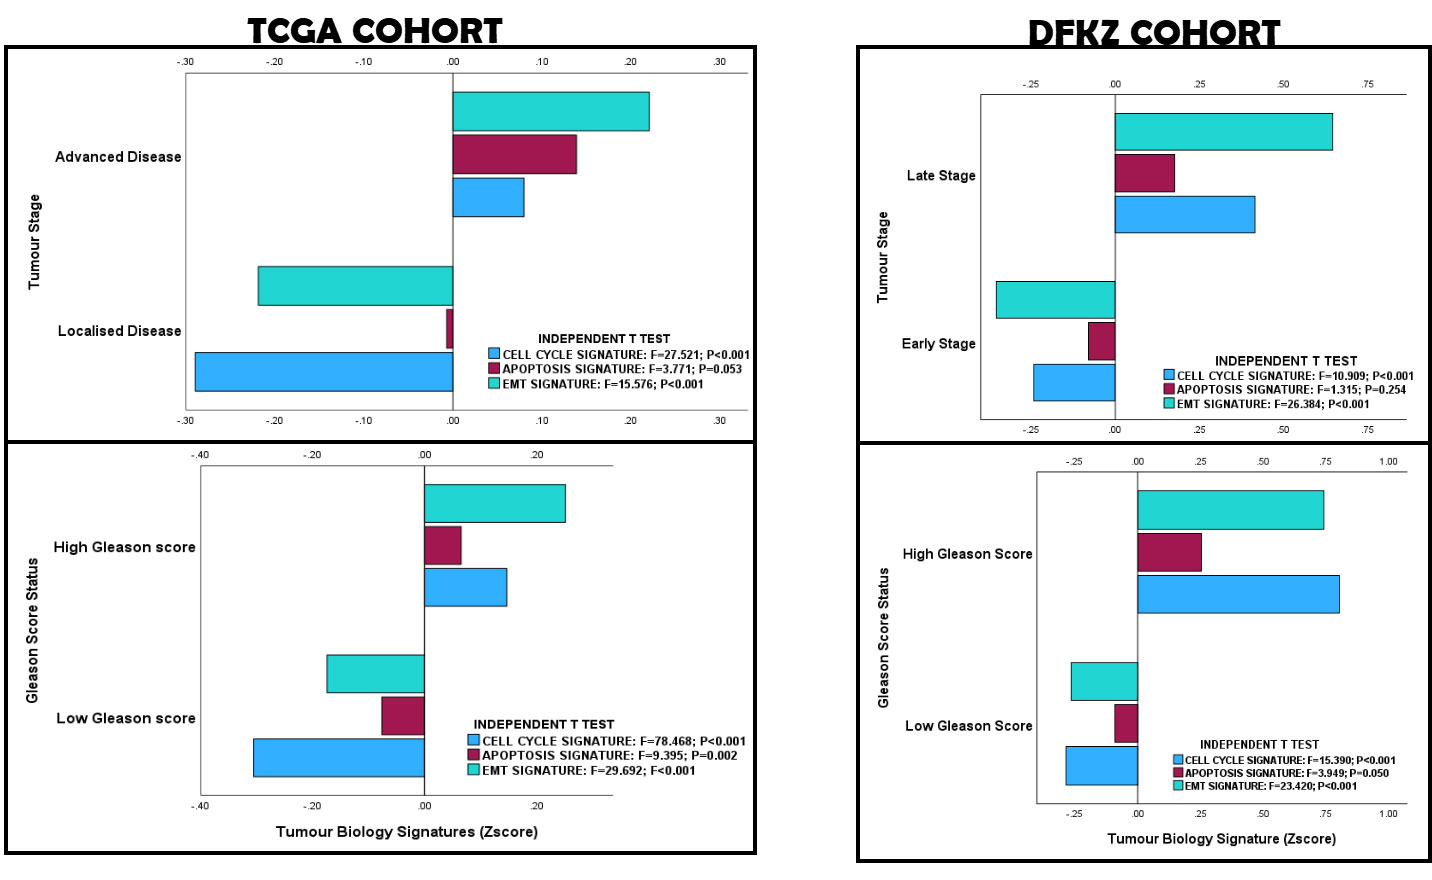 Figure 3. KRAS-based Tumour Biology Signature Validation in the TCGA and DFKZ PCa cohorts. The correlation of the clinicopathological features of the prostate cancer cohort with tumour biology validates the activation of wild-type KRAS signalling in prostate cancer.
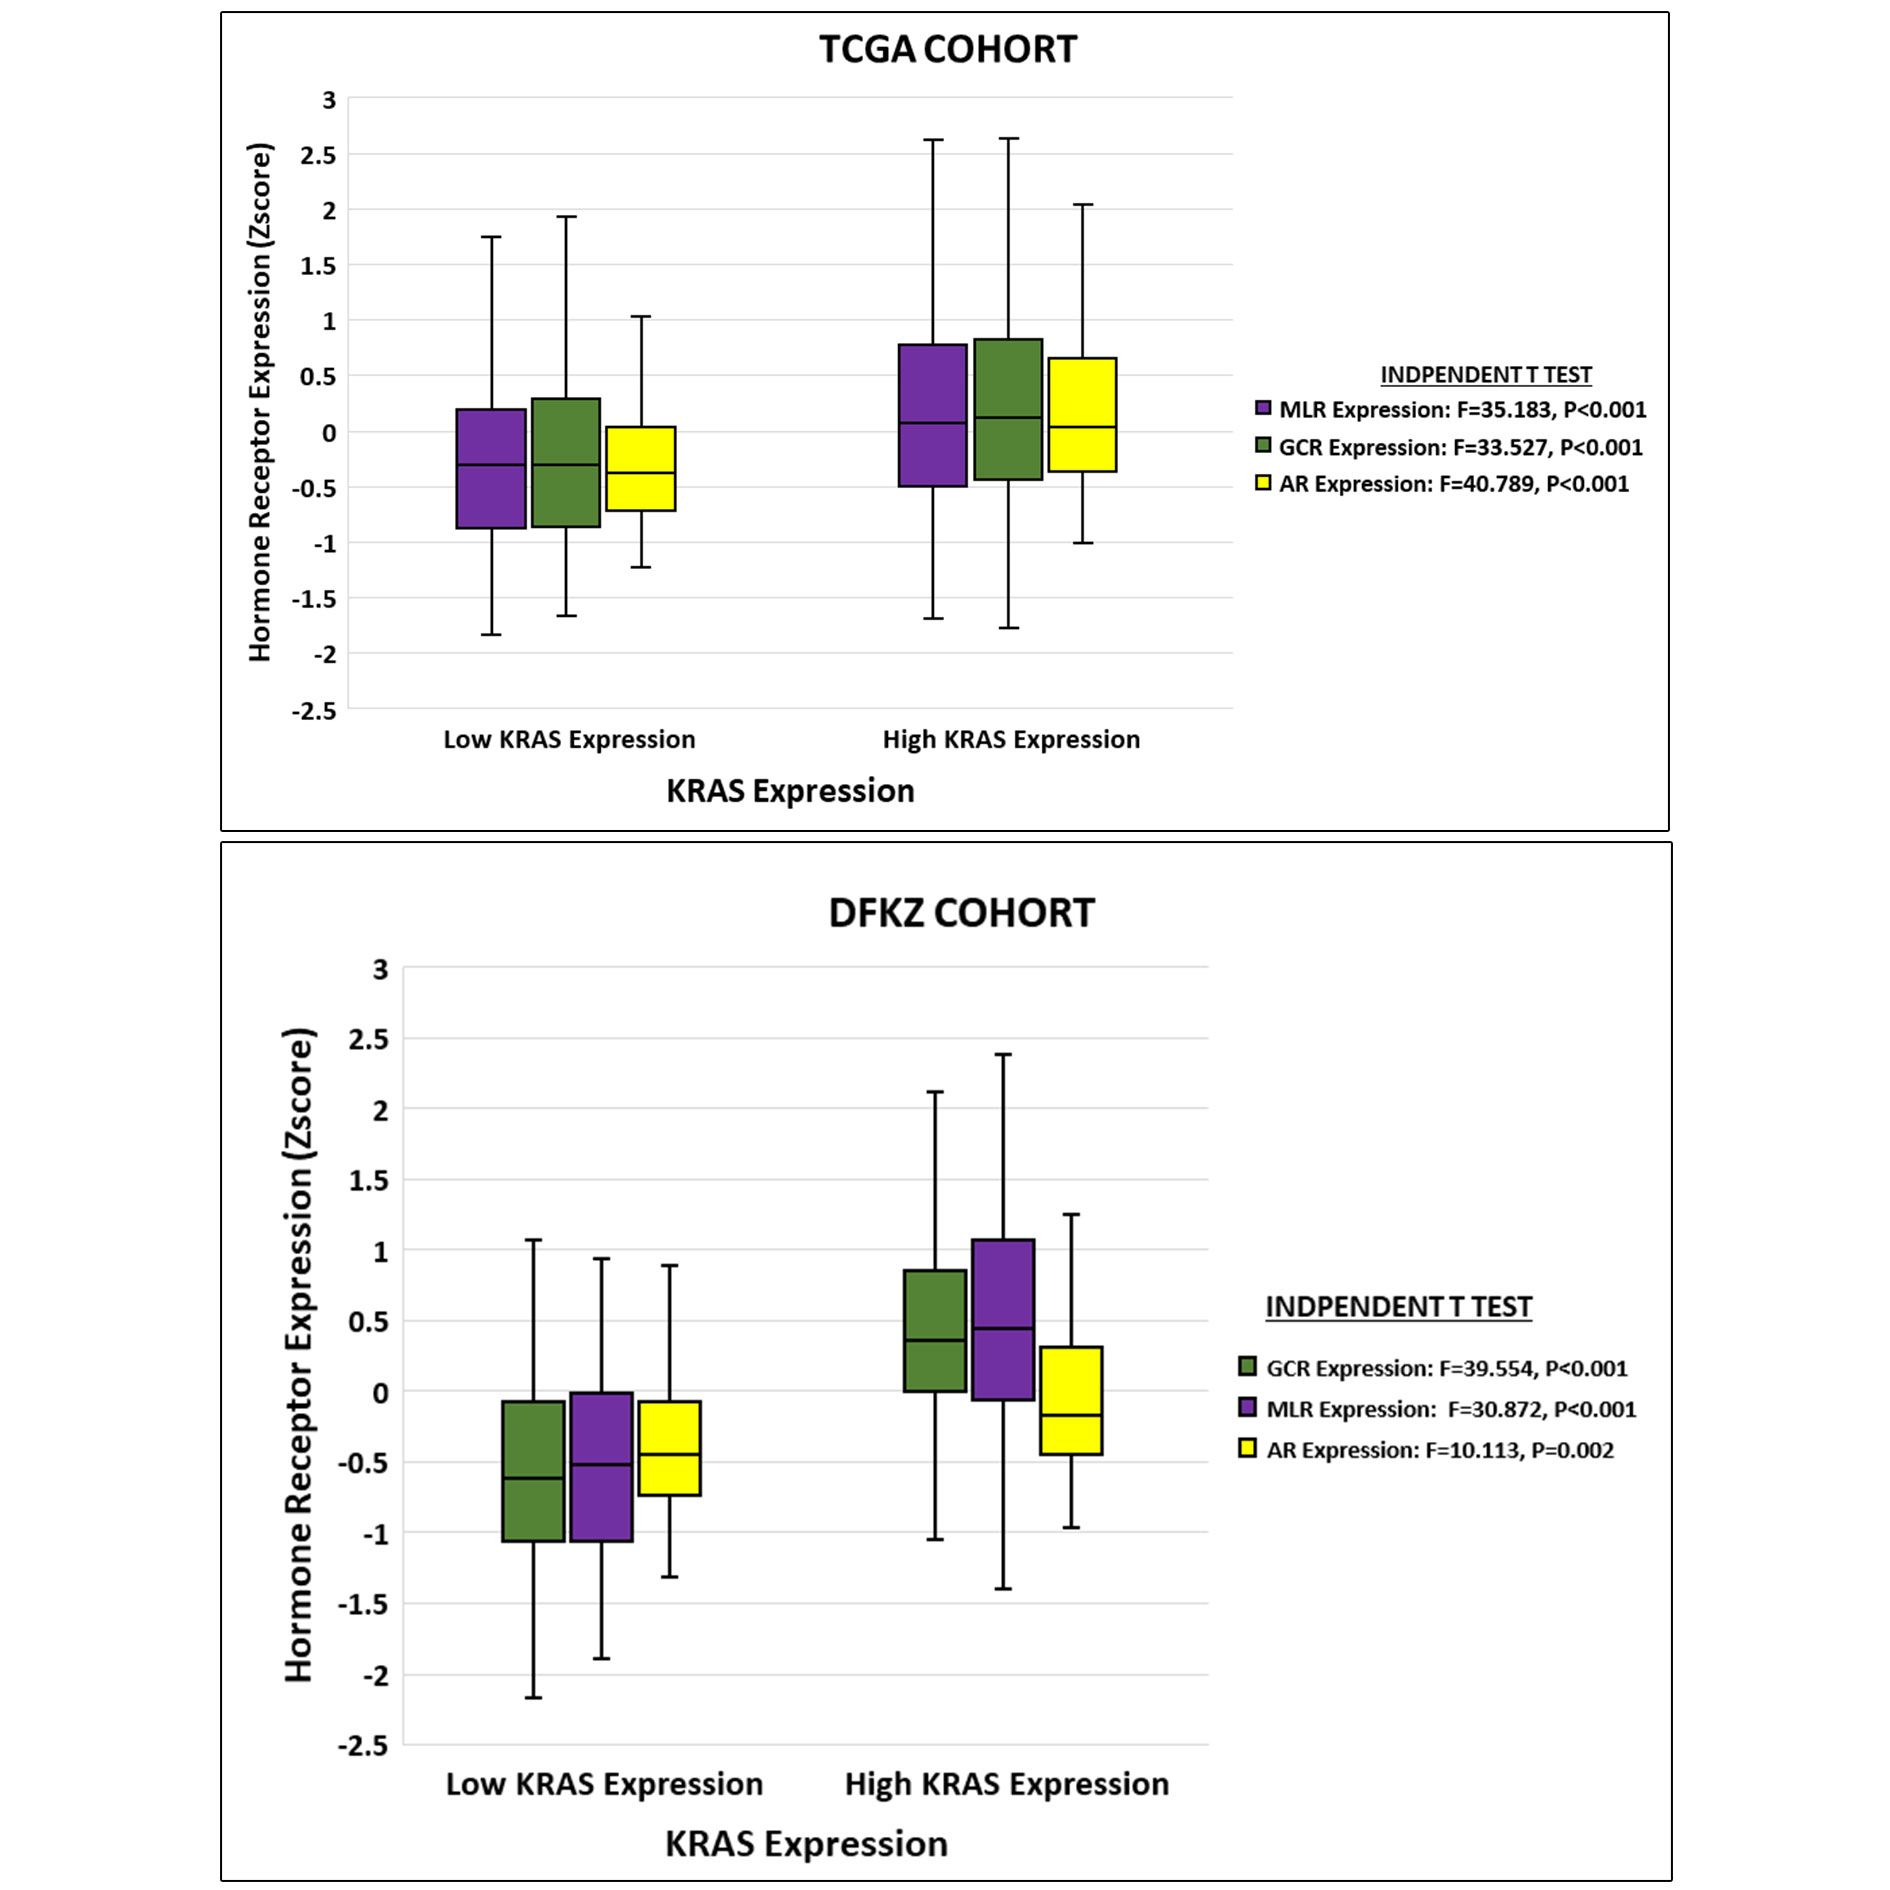 Figure 4. Relationships between KRAS expression and steroid hormone receptor expression in PCa. High expression of KRAS is associated with high expression of AR, GCR and MLR in TCGA and DFKZ cohorts.
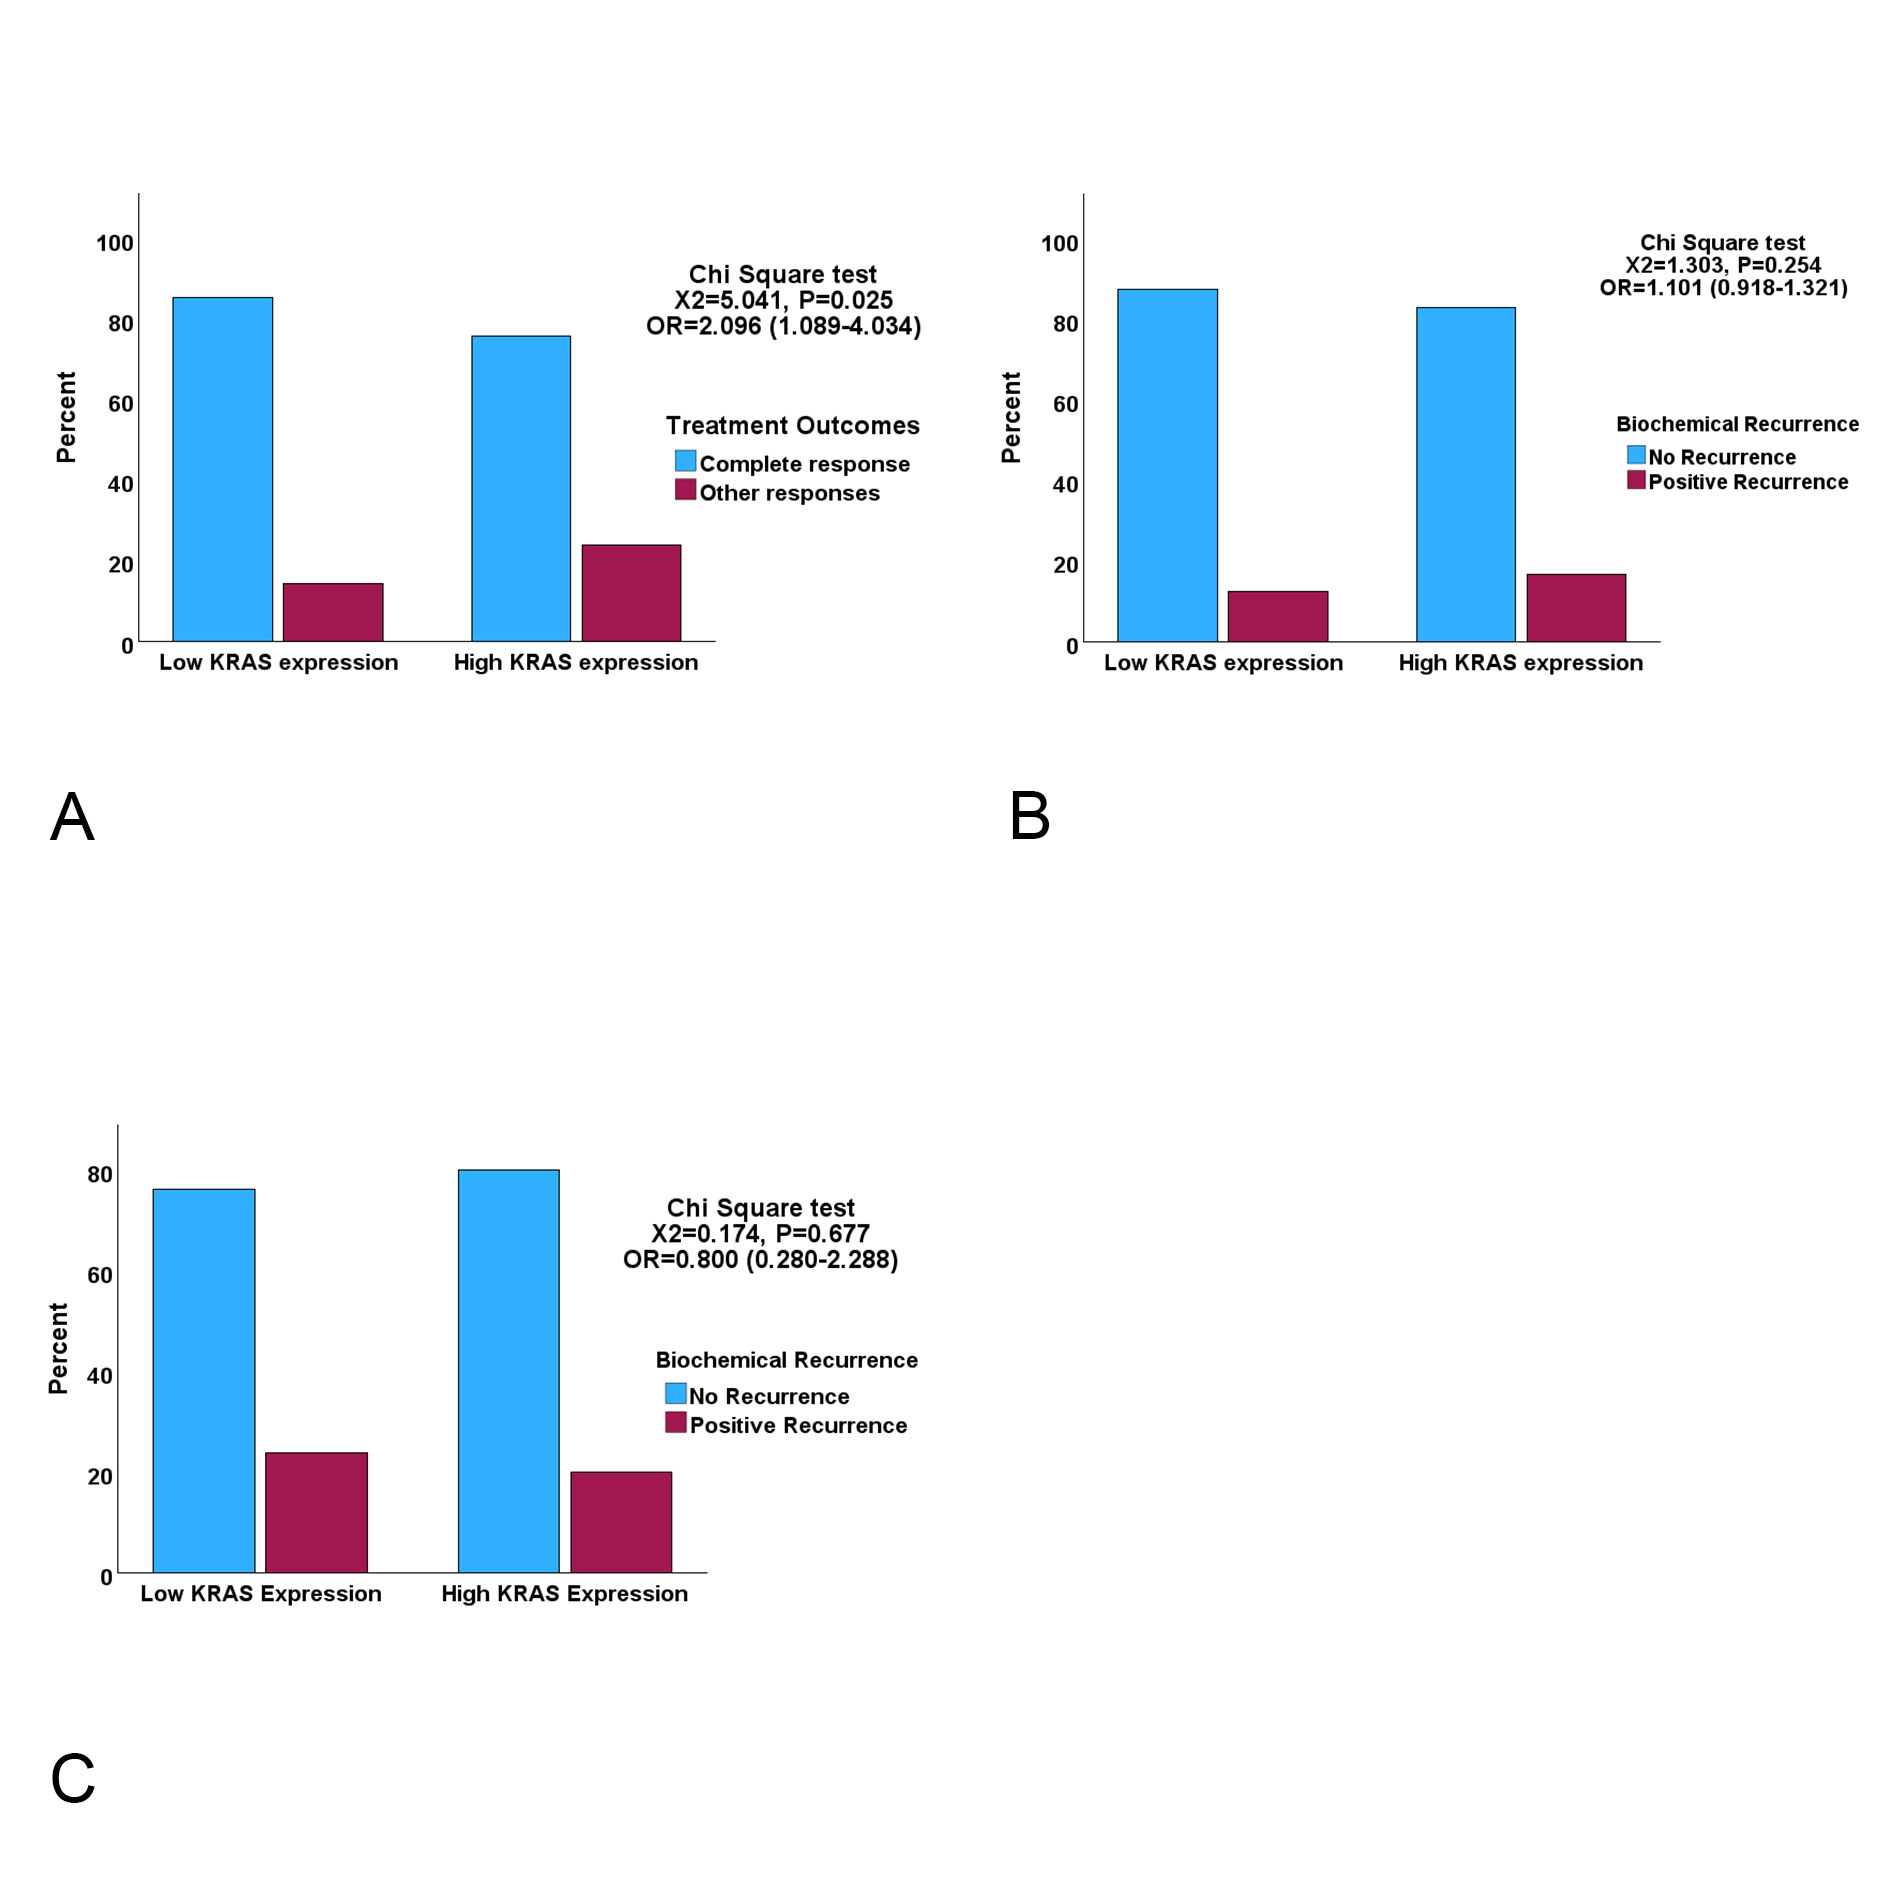 Figure 5. Clustered bar charts showing the relationships between KRAS expression and treatment outcome indices A. High KRAS expression cases are significantly more likely to have incomplete response to ADT than low KRAS cases (OR=Odds Ratio) B. & C. Biochemical recurrence status for TCGA (B) and DFKZ (C) cohorts showing that KRAS expression did not display significant associations with biochemical recurrence.
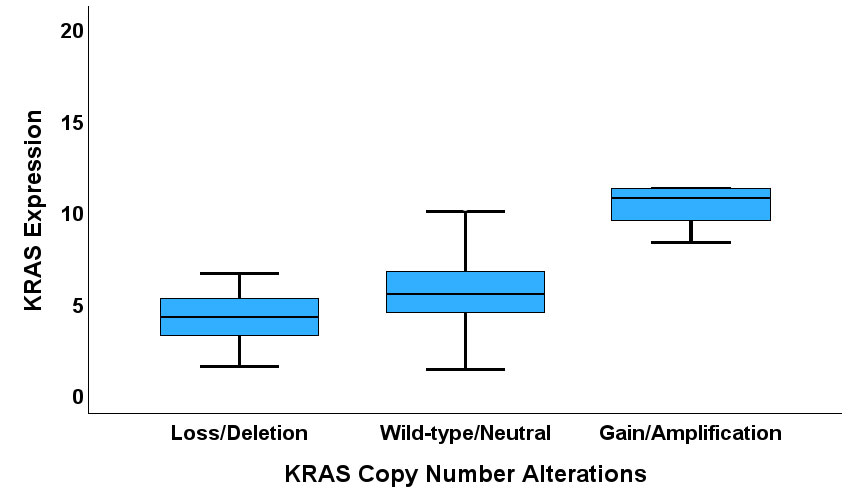 Figure 6. A Box plot showing correlation between KRAS CNA and expression.
This study validated previous cell line studies in two ways. First, the enrichment of the KRAS activation gene sets in the PCa cohorts confirmed that KRAS is activable in cancer in the absence of KRAS somatic mutations. This is in consonance with the study by Mita et al, which found that knockdown of KRAS in gastric cell lines which overexpressed wild-type KRAS resulted in inhibition of tumour growth and suppression of p44/42 MAP kinase (MAPK1 or ERK2) and AKT activity [12]. It also concurs with the Valtorta et al study which demonstrated resistance of anti-EGFR therapy in a colorectal cancer cell line with KRAS overexpression (via gene amplification) [13]. Furthermore, the Laboda et al study demonstrated wild-type KRAS activation in breast cancer (which have low frequency of somatic KRAS mutations), and in lung and colorectal cancer subsets with wild-type KRAS expression, providing evidence that even in cancer types with high rates of somatic KRAS mutations, wild-type KRAS signalling can be active [14]. Secondly, this study confirmed the results of cell line studies which have demonstrated active wild-type KRAS signalling in PCa cell lines, and upregulation of KRAS expression in primary PCa [15-23, 28, 48-51]. According to these studies, KRAS expression regulates the fundamental tumour biology of PCa, including cell proliferation, EMT, metastasis and stem cell activities [12, 18-23, 49, 50], and in cooperation with other signalling pathways including PI3K, WNT, β-catenin, and hedgehog signalling [16, 18, 20, 21, 48, 51, 52]. In consonance with these previous results, this study demonstrated enrichment of cell cycle and G1/S transition of mitotic cycle, G2/M transition, regulation of cell population proliferation, regulation of cell cycles, regulation of cell population proliferation, RAS and EGF signalling pathways, MAPK signal-ling, TGFB signalling, PI3K signalling, extracellular matrix pathways, and EMT pathway genes in the KRAS-high subset of both PCa cohorts.
In keeping with the patterns of enrichment of tumour-promoting gene sets in the PCa cohorts, the study found adverse clinicopathological features of the PCa in the KRAS-high subsets. For example, the KRAS-high subsets displayed higher stage, Gleason score, ISUP prognostic grade groups and poorer therapy outcomes. There is paucity of studies which have investigated the clinicopathological features of KRAS in PCa, hence only a small frame of reference for the clinicopathological relevance of KRAS expression in PCa exists for comparison. However, Yin et al [19] and Yang et al [50] showed that high KRAS expression is associated with bone metastasis. Plus, cell line studies have demonstrated some reverse correlation between KRAS expression and response to therapy. Activation of the KRAS signalling is associated with resistance to anti-androgen and other therapies in PCa sell lines [16, 17, 51].
Further on therapy resistance, this study demonstrated a significant relationship between KRAS expression and the therapy-resistance markers AR, GCR and MLR [40-44] in both PCa cohorts. However, no relationship could be established between treatment outcomes and KRAS expression independent of AR expression, a result that suggested that the relationship between KRAS expression and clinical response to ADT may be AR-dependent, at least in the TCGA PCa cohort. Barkin et al. [13] demonstrated that attenuation of RAS signalling restored sensitivity to hormone-refractory PCa cell lines. Also, an AR-KRAS axis signalling, which mediates malignant transformation and induction of stem cells characteristics, has been described for PCa cells [52, 53]. The role of cancer stem cells in therapy resistance is established in oncology [54]. It is therefore plausible that KRAS signalling acts upstream of AR signalling in the development of resistance to ADT, hence the relationship between KRAS expression and therapy outcome would be dependent on AR expression. Whilst this study did not find an independent link between KRAS expression and treatment outcome, the fact of high KRAS expression being associated with enrichment of PI3K signalling in this and other studies [13, 18, 19, 20, 48, 51] suggests an indirect association of KRAS expression with treatment response. The prospect of targeting KRAS for the circumvention of ADT resistance is an attractive one [13, 55]. Considering that tumours can have RAS activation independent of KRAS somatic mutations [12, 13], it is plausible that some therapies which are designed to target KRAS mutation-driven tumours would also find application in treating wild-type KRAS-driven tumours. KRAS- and KRAS signalling-specific drugs, whose targets reside outside the KRAS mutations hotspots, such as those that target KRAS membrane association [40], inhibit KRAS processing and activation [55-57], target downstream mediators of intracellular signalling [56], and target KRAS synthetic lethal partnerships [56, 58], may find utility in the treatment of PCa cases with high KRAS expression.
The study also showed that KRAS deregulation may be predominantly transcriptional and/or translational via epigenetic and miRNA mechanisms. This finding is supported by a previous preclinical study which demonstrated transcriptional deregulation of KRAS expression at the promoter site [50]. Copy number alteration of KRAS has been demonstrated to be a mechanism of KRAS deregulation in gastric, lung and colorectal cancers [12, 13]. Therefore, testing KRAS promoter methylation, KRAS-targeting microRNA expression or KRAS copy number changes may be useful in the diagnosis of active KRAS signalling in PCa. Furthermore, whilst structural variants such as KRAS fusions [59] may lead to the upregulation of KRAS expression in PCa, as would KRAS gain or amplification, no gene fusion data were available for the TCGA or DFKZ PCa datasets utilized in this study. Hence, the level of contribution of KRAS gene fusions to KRAS expression levels in primary PCa could not be determined in this study.
Not applicable.
Author contribution
Conception or design of the work was done by H.O.E.; Data collection was performed by H.O.E. and P.A.A.; Data analysis and interpretation were done by S.A.O., U.S.E., P.A.A., A.E.A., O.I., C.A.E., J.C.A., N.C., A.O.A, C.U.A., M.I.M., I.D.N.; Drafting the article was undertaken by H.O.E., S.A.O.; Critical revision of the article performed by U.S.E., P.A.A., A.E.A., O.I., C.A.E., J.C.A., N.C., A.O.A, C.U.A., M.I.M., and I.D.N. Final approval of submitted manuscript (All the authors).
Competing interest
All the authors declare no conflict of interest.
Acknowledgements
The authors wish to express their gratitude to the Cancer Genome Atlas and the cBioPortal for Cancer Genomics for making the data used in this study publicly available.
Funding
This research did not receive any specific grant from funding agencies in the public, commercial or not-for-profit sectors.
- Vlajnic T, Bubendorf L: Molecular pathology of prostate cancer: a practical approach. Pathology 2021, 53(1): 36-43.
- Faisal FA, Lotan TL: The Genomic and Molecular Pathology of Prostate Cancer: Clinical Implications for Diagnosis, Prognosis, and Therapy. Adv Anat Pathol 2020, 27(1): 11-19.
- Sung H, Ferlay J, Siegel RL, Laversanne M, Soerjomataram I, Jemal A, Bray F: Global Cancer Statistics 2020: GLOBOCAN Estimates of Incidence and Mortality Worldwide for 36 Cancers in 185 Countries. CA Cancer J Clin 2021, 71(3): 209-249.
- Ferlay J, Colombet M, Soerjomataram I, Parkin DM, Piñeros M, Znaor A, Bray F: Cancer statistics for the year 2020: An overview. Int J Cancer 2021, 149: 778-789.
- O’Sullivan É, Keogh A, Henderson B, Finn SP, Gray SG, Gately K: Treatment Strategies for KRAS-Mutated Non-Small-Cell Lung Cancer. Cancers 2023, 15(6): 1635.
- Jonker DJ, O'Callaghan CJ, Karapetis CS, Zalcberg JR, Tu D, Au HJ, Berry SR, Krahn M, Price T, Simes RJ, et al: Cetuximab for the treatment of colorectal cancer. N Engl J Med 2007, 357(20): 2040-2048.
- Janani B, Vijayakumar M, Priya K, Kim JH, Prabakaran DS, Shahid M, Al-Ghamdi S, Alsaidan M, Othman Bahakim N, Hassan Abdelzaher M, et al: EGFR-Based Targeted Therapy for Colorectal Cancer-Promises and Challenges. Vaccines (Basel) 2022, 10(4): 499.
- Maron SB, Xu J, Janjigian YY: Targeting EGFR in Esophagogastric Cancer. Front Oncol 2020, 10: 553876.
- Mustachio LM, Chelariu-Raicu A, Szekvolgyi L, Roszik J: Targeting KRAS in Cancer: Promising Therapeutic Strategies. Cancers 2021, 13: 1204.
- Simanshu DK, Nissley DV, McCormick F: RAS Proteins and Their Regulators in Human Disease. Cell 2017, 170(1): 17-33.
- Saito Y, Koya J, Araki M, Kogure Y, Shingaki S, Tabata M, McClure MB, Yoshifuji K, Matsumoto S, Isaka Y, et al: Landscape and function of multiple mutations within individual oncogenes. Nat Cell Biol 2020, 582(7810): 95-99.
- Mita H, Toyota M, Aoki F, Akashi H, Maruyama R, Sasaki Y, Suzuki H, Idogawa M, Kashima L, Yanagihara K, et al: A novel method, digital genome scanning detects KRAS gene amplification in gastric cancers: involvement of overexpressed wild-type KRAS in downstream signaling and cancer cell growth. BMC Cancer 2009, 9: 198.
- Valtorta E, Misale S, Sartore-Bianchi A, Nagtegaal ID, Paraf F, Lauricella C, Dimartino V, Hobor S, Jacobs B, Ercolani C, et al: KRAS gene amplification in colorectal cancer and impact on response to EGFR-targeted therapy. Int J Cancer 2013, 133(5): 1259-1265.
- Loboda A, Nebozhyn M, Klinghoffer R, Frazier J, Chastain M, Arthur W, Roberts B, Zhang T, Chenard M, Haines B, et al: A gene expression signature of RAS pathway dependence predicts response to PI3K and RAS pathway inhibitors and expands the population of RAS pathway activated tumors. BMC Med Genomics 2010, 3: 26.
- Butler DE, Marlein C, Walker HF, Frame FM, Mann VM, Simms MS, Davies BR, Collins AT, Maitland NJ: Inhibition of the PI3K/AKT/mTOR pathway activates autophagy and compensatory Ras/Raf/MEK/ERK signalling in prostate cancer. Oncotarget 2017, 8(34): 56698-56713.
- Barkin RE, Gioeli D, Bissonette EA, Weber MJ: Attenuation of Ras Signalling Restores Androgen Sensitivity to Hormone-refractory C4-2 Prostate Cancer Cells. Cancer Res 2003, 63(8): 1975-1980.
- Erlich S, Tal-Or P, Liebling R, Blum R, Karunagaran D, Kloog Y, Pinkas-Kramarski R: Ras inhibition results in growth arrest and death of androgen-dependent and androgen-independent prostate cancer cells. Biochem Pharmacol 2006, 72(4): 427-436.
- Suzuki A, Nakano T, Mak TW, Sasaki T: Portrait of PTEN: Messages from mutant mice. Cancer Science 2008, 99: 209-213.
- Yin J, Pollock C, Tracy K, Chock M, Martin P, Oberst M, Kelly K: Activation of the RalGEF/Ral pathway promotes prostate cancer metastasis to bone. Mol Cell Biol 2007, 27(21): 7538-7550.
- Mulholland DJ, Kobayashi N, Ruscetti M, Zhi A, Tran LM, Huang J, Gleave M, Wu H: Pten loss and RAS/MAPK activation cooperate to promote EMT and metastasis initiated from prostate cancer stem/progenitor cells. Cancer Res 2012, 72(7): 878-1889.
- Jefferies MT, Cox AC, Shorning BY, Meniel V, Griffiths D, Kynaston HG, Smalley MJ, Clarke AR: PTEN loss and activation of K-RAS and β-catenin cooperate to accelerate prostate tumourigenesis. J Pathol 2017, 243: 442-456.
- Rybak AP, Bristow RG, Kapoor A: Prostate cancer stem cells: deciphering the origins and pathways involved in prostate tumorigenesis and aggression. Oncotarget 2015, 6(4): 1900-1919.
- Jeong JH, Wang Z, Guimaraes AS, Ouyang X, Figueiredo JL, Ding Z, Jiang S, Guney I, Kang GH, Shin E: BRAF activation initiates but does not maintain invasive prostate adenocarcinoma. PLoS One 2008, 3(12): e3949.
- Noorbakhsh J, Vazquez F, McFarland JM: Bridging the gap between cancer cell line models and tumours using gene expression data. Br J Cancer 2021, 125(3): 311-312.
- Wilding JL, Bodmer WF: Cancer Cell Lines for Drug Discovery and Development. Cancer Res 2014, 74 (9): 2377-2384.
- Roschke AV, Tonon G, Gehlhaus KS, McTyre N, Bussey KJ, Lababidi S, Scudiero DA, Weinstein JN, Kirsch IR: Karyotypic complexity of the NCI-60 drug-screening panel. Cancer Res 2003, 63: 8634-8647.
- Daniel VC, Marchionni L, Hierman JS, Rhodes JT, Devereux WL, Rudin CM, Yung R, Parmigiani G, Dorsch M, Peacock CD, et al: A primary xenograft model of small-cell lung cancer reveals irreversible changes in gene expression imposed by culture in vitro. Cancer Res 2009, 69(8): 3364-3373
- Taylor BS, Schultz N, Hieronymus H, Gopalan A, Xiao Y, Carver BS, Arora VK, Kaushik P, Cerami E, Reva B, et al: Integrative genomic profiling of human prostate cancer. Cancer Cell 2010, 18(1): 11-22.
- Cerami E, Gao J, Dogrusoz U, Gross BE, Sumer SO, Aksoy BA, Jacobsen A, Byrne CJ, Heuer ML, Larsson E, et al: The cBio cancer genomics portal: an open platform for exploring multidimensional cancer genomics data. Cancer Discov 2012, 2(5): 401-404.
- Gao J, Aksoy BA, Dogrusoz U, Dresdner G, Gross B, Sumer SO, Sun Y, Jacobsen A, Sinha R, Larsson E, et al: Integrative analysis of complex cancer genomics and clinical profiles using the cBioPortal. Sci Signal 2013, 6(269): pl1.
- Gerhauser C, Favero F, Risch T, Simon R, Feuerbach L, Assenov Y, Heckmann D, Sidiropoulos N, Waszak SM, Hübschmann D, et al: Molecular Evolution of Early-Onset Prostate Cancer Identifies Molecular Risk Markers and Clinical Trajectories. Cancer Cell 2018, 34(6): 996-1011.e8.
- Subramanian A, Tamayo P, Mootha VK, Mukherjee S, Ebert BL, Gillette MA, Paulovich A, Pomeroy SL, Golub TR, Lander ES, et al: Gene set enrichment analysis: a knowledge-based approach for interpreting genome-wide expression profiles. PNAS USA 2005, 102(43): 15545-15550.
- Liberzon A, Subramanian A, Pinchback R, Thorvaldsdóttir H, Tamayo P, Mesirov JP: Molecular signatures database (MSigDB) 3.0. Bioinformatics 2011, 27(12): 1739-1740.
- Liberzon A, Birger C, Thorvaldsdóttir H, Ghandi M, Mesirov JP, Tamayo P: The Molecular Signatures Database (MSigDB) hallmark gene set collection. Cell Syst 2015, 1(6): 417-425.
- Gene Ontology Consortium; Aleksander SA, Balhoff J, Carbon S, Cherry JM, Drabkin HJ, Ebert D, Feuermann M, Gaudet P, Harris NL, et al: The Gene Ontology knowledgebase in 2023. Genetics 2023, 224(1): iyad031.
- Ashburner M, Ball CA, Blake JA, Botstein D, Butler H, Cherry JM, Davis AP, Dolinski K, Dwight SS, Eppig JT, et al: Gene Ontology: tool for the unification of biology. Nat Genet 2000, 25(1): 25-29.
- Barbie DA, Tamayo P, Boehm JS, Kim SY, Moody SE, Dunn IF, Schinzel AC, Sandy P, Meylan E, Scholl C, et al: Systematic RNA interference reveals that oncogenic KRAS-driven cancers require TBK1. Nature 2009, 462(7269): 108-112.
- Vallania F, Zisman L, Macaubas C, Hung SC, Rajasekaran N, Mason S, Graf J, Nakamura M, Mellins ED, Khatri P: Multicohort Analysis Identifies Monocyte Gene Signatures to Accurately Monitor Subset-Specific Changes in Human Diseases. Front Immunol 2021, 12: 659255.
- Feys S, Heylen J, Carvalho A, Van Weyenbergh J, Wauters J, Variomic Study Group: A signature of differential gene expression in bronchoalveolar lavage fluid predicts mortality in influenza-associated pulmonary aspergillosis. Intensive Care Med 2023, 49(2): 254-257.
- Yehya A, Ghamlouche F, Zahwe A, Zeid Y, Wakimian K, Mukherji D, Abou-Kheir W: Drug resistance in metastatic castration-resistant prostate cancer: an update on the status quo. Cancer Drug Resist 2022, 5(3): 667-690.
- Kushwaha PP, Gupta S: New insights for drug resistance in metastatic castration-resistant prostate cancer. Cancer Drug Resist 2022, 5(3): 846-849.
- Kumar R: Emerging role of glucocorticoid receptor in castration resistant prostate cancer: A potential therapeutic target. J Cancer 2020, 11(3): 696-701.
- Kaochar S, Mitsiades N: Glucocorticoids mediate adverse events of deep androgen receptor axis inhibition in prostate cancer patients. Ann Oncol 2020, 31(3): 323-325.
- Shiota M, Fujimoto N, Higashijima K, Imada K, Kashiwagi E, Takeuchi A, Inokuchi J, Tatsugami K, Kajioka S, Uchiumi T, et al: Mineralocorticoid receptor signalling affects therapeutic effect of enzalutamide. Prostate 2018, 78: 1045-1052.
- Reich M, Liefeld T, Gould J, Lerner J, Tamayo P, Mesirov JP: GenePattern 2.0. Nat Genet 2006, 38(5): 500-501.
- Huang HY, Lin YC, Cui S, Huang Y, Tang Y, Xu J, Bao J, Li Y, Wen J, Zuo H, et al: miRTarBase update 2022: an informative resource for experimentally validated miRNA-target interactions. Nucleic Acids Res 2022, 50(D1): D222-D230.
- Pujato M, Kieken F, Skiles AA, Tapinos N, Fiser A: Prediction of DNA binding motifs from 3D models of transcription factors; identifying TLX3 regulated genes. Nucleic Acids Res 2014, 42(22): 13500-13512.
- Shorning BY, Dass MS, Smalley MJ, Pearson HB: The PI3K-AKT-mTOR Pathway and Prostate Cancer: At the Crossroads of AR, MAPK, and WNT Signaling. Int J Mol Sci 2020, 21(12): 4507.
- Ngalame NN, Tokar EJ, Person RJ, Waalkes MP: Silencing KRAS overexpression in arsenic-transformed prostate epithelial and stem cells partially mitigates malignant phenotype. Toxicol Sci 2014, 142(2): 489-496.
- Yang Q, Lang C, Wu Z, Dai Y, He S, Guo W, Huang S, Du H, Ren D, Peng X: MAZ promotes prostate cancer bone metastasis through transcriptionally activating the KRas-dependent Ral-GEFs pathway. J Exp Clin Cancer Res 2019, 38(1): 391.
- Bouali S, Chrétien A, Ramacci C, Rouyer M, Becuwe P, Merlin J: PTEN expression controls cellular response to cetuximab by mediating PI3K/AKT and RAS/RAF/MAPK downstream signaling in KRAS wild-type, hormone refractory prostate cancer cells. Oncol Rep 2009, 21(3): 731-735.
- Wu M, Ingram L, Tolosa EJ, Vera RE, Li Q, Kim S, Ma Y, Spyropoulos DD, Beharry Z, Huang J, et al: Gli Transcription Factors Mediate the Oncogenic Transformation of Prostate Basal Cells Induced by a Kras-Androgen Receptor Axis. J Biol Chem 2016, 291(49): 25749-25760.
- Cai H, Memarzadeh S, Stoyanova T, Beharry Z, Kraft AS, Witte ON: Collaboration of Kras and androgen receptor signaling stimulates EZH2 expression and tumor-propagating cells in prostate cancer. Cancer Res 2012, 72(18): 4672-4681.
- Kushwaha PP, Verma S, Kumar S, Gupta S: Role of prostate cancer stem-like cells in the development of antiandrogen resistance. Cancer Drug Resist 2022, 5(2): 459-471.
- Hillig RC, Sautier B, Schroeder J, Moosmayer D, Hilpmann A, Stegmann CM, Werbeck ND, Briem H, Boemer U, Weiske J, et al: Discovery of potent SOS1 inhibitors that block RAS activation via disruption of the RAS-SOS1 interaction. PNAS USA 2019, 116(7): 2551-2560.
- Merz V, Gaule M, Zecchetto C, Cavaliere A, Casalino S, Pesoni C, Contarelli S, Sabbadini F, Bertolini M, Mangiameli D, et al: Targeting KRAS: The Elephant in the Room of Epithelial Cancers. Front Oncol 2021, 11: 638360.
- Wong GS, Zhou J, Liu JB, Wu Z, Xu X, Li T, Xu D, Schumacher SE, Puschhof J, McFarland J, et al: Targeting wild-type KRAS-amplified gastroesophageal cancer through combined MEK and SHP2 inhibition. Nat Med 2018, 24(7): 968-977.
- Liu P, Wang Y, Li X: Targeting the untargetable KRAS in cancer therapy. Acta Pharm Sin B 2019, 9(5): 871-879.
- Wang XS, Shankar S, Dhanasekaran SM, Ateeq B, Sasaki AT, Jing X, Robinson D, Cao Q, Prensner JR, Yocum AK, et al: Characterization of KRAS rearrangements in metastatic prostate cancer. Cancer Discov 2011, 1(1): 35-43.
Annals of urologic oncology
p-ISSN: 2617-7765, e-ISSN: 2617-7773
 Copyright © Ann Urol Oncol. This work is licensed under a Creative Commons Attribution-NonCommercial-No Derivatives 4.0 International (CC BY-NC-ND 4.0) License.