
 Submit Manuscript
Research Article | Open Access
Study of Immunohistochemical Marker Psma and Ki 67 Expression and Its Relation with Grading in Prostate Carcinoma
Amit V Varma1, Seema Jindal1, Bela Sharda1, Kamal Malukani1, Shilpi Dosi1, Pooja Kesharwani1
1Department of Pathology, Shri Aurobindo Medical College and PG Institute, Indore, India.
Correspondence: Bela Sharda (Department of Pathology, Shri Aurobindo Medical College and PG Institute, Indore, India. Email: dr.bela22@gmail.com).
Annals of Urologic Oncology 2022; 5(1): 20-33. https://doi.org/10.32948/auo.2022.08.29
Received: 08 Jul 2022 | Accepted: 29 Aug 2022 | Published online: 30 Aug 2022 
Method A total of 52 cases of prostate carcinoma diagnosed on histopathology as adenocarcinoma in the Department of surgical pathology within 2.5 years duration were further studied immunohistochemically by PSMA and Ki 67 antibodies.
Results At the time of presentation most of the cases have serum PSA level 11-50 ng/ml and with increasing Gleason score it can be ≥100ng/ml. Majority of cases have Gleason score 7 and the most common Gleason grade group is 2. PSMA and Ki 67 IHC marker is significantly correlated with Gleason score and Gleason grade group. PSMA expression is significantly correlated with perineural invasion and Ki 67 with bone metastasis.
Conclusion PSMA and Ki 67 IHC marker can be used in conjunction with or as a substitute to Gleason scoring system for proper risk.
Key words prostate cancer, Ki-67, PSMA, gleason scoring system
Haematoxylin solution (Harris's) and eosin solution
In this study the histopathological sections were evaluated after staining by Haematoxylin and Eosin technique.
Haematoxylin 2.5gm, Absolute alcohol 25 ml,Potash alum 50 gms, Mercuric oxide 1.25 gms, Distilled water 500 ml ,Glacial acetic acid 20 ml.
Haematoxylin was dissolved in alcohol and added to alum dissolved in warm distilled water. This mixture was brought rapidly to boil and mercuric iodide was added slowly and carefully. The solution was cooled rapidly and glacial acetic acid was added and kept in dark brown bottle.
Eosin 1 gm , Distilled water 100 ml.
Staining procedure for histological section
Glass slide with tissue section was put over a hot plate for few seconds. Xylene 15 mins ,Xylene 15 mins, Hydrate through 95% alcohol – 2 min; 80% alcohol – 10 dips; 70% alcohol – 10 dips; 50% alcohol – 10 dips; Bring to water – 10 dips; Stain in alum haematoxylin – 15 minutes Wash in running tap water ,Differentiate 1% acid alcohol – 3-4 dips, Wash in running tap water till sections blue, Ammonia – 1 min ,Stain in 1% Eosin solution – 8-10 minutes, Wash in running tap water – 1-5 minute, Dehydrate through 50% alcohol – 10 dips, 70% alcohol 10 dips, 90% alcohol 10 dips, 95% alcohol 10 dips, Absolute alcohol 10 dips. Sections were dried and mounted using DPX mountant. Sections were studied under the microscope and histopathological diagnosis was made as per WHO classification for prostate cancers. Histological grading of prostate adenocarcinoma was done and categorized as Grade-I, II, III, IV, & V. The cases that were reported as Adenocarcinoma were further studied for Immunohistochemical staining by PSMA and Ki 67 antibodies.
Immunostaining protocol
Representative formalin fixed Paraffin embedded blocks were selected. Three um thick sections were cut from each block and sections were taken on poly-L-lysine coated slides. Immunostaining was done by Streptavidin- biotin immunoperoxidase technique (LSAB) using readymade antibody to PSMA and Ki 67(Diagnostic Biosystem, USA). Serial 3um thick sections were cut from representative paraffin embedded tissue blocks and taken on poly-L-lysine coated slides. Deparaffinization was done as per standard protocol (three changes of xylene for 15 minutes each and two change of ethyl alcohol for 1 minute each). Then the slides were rehydrated in decreasing concentration of alcohol (95% alcohol for 3 minutes, 70% alcohol for 3 minutes, distilled water for 1 minute). Antigen retrieval of all slides was done by heating the sections immersed in appropriate buffer in a pressure cooker till first whistle and then continues to heat till 7 minutes.
Buffer used- Citrate buffer (10mMol/L) was used in antigen retrieval, Anhydrous citric acid crystals 2.4 gram, Distilled water: 1litre (Dissolved, made solution of 1litre), pH: 6.4. All slides were brought to room temperature and then treated with 0.05M Tris-HCL buffer pH 7.4.
Protocol of staining
To minimize the non-specific staining (due to action of endogenous peroxidase) each slide was treated with methanol containing 4% hydrogen peroxidase for 30 minutes. After rinsing, the slides were placed in 0.05M-Tris – HCL buffer pH 7.4 for 10 minutes. Excess buffer was removed by wiping of the slides.Sections were covered with adequate amount of primary antibody in the specified dilutions and incubated for 1 hr 20 minutes in a humid chamber at room temperature for PSMA and at 22?c for Ki 67. Primary antibody (purified rabbit for IgG for Ki 67 and mouse monoclonal for PSMA) was obtained from (Diagnostic Biosystem, USA) in dilution 1:50 for Ki 67, and PSMA). The slides were washed three times in 0.05M Tris-HCL buffer pH 7.4 followed by incubation at room temperature for 25 minutes for PSMA and at 22?C for ki 67 with biotinylated secondary antibody of anti-mouse antiglobulins in phosphate buffer saline (PBS) containing carrier protein and Sodium Azide ( 15mMOL/l) large volume (universal Biogenex kit). After 3 washings (5 minute each) in Tris-HCL buffer, Horse Radish peroxidase (HRP) conjugated Streptavidin was used to cover the slides at room temperature for PSMA and at 22?C for ki 67 and incubated for 30minutes. After finishing of the above steps, slides were again rinsed thrice in 0.05MTris- HCL buffer PH 7.4 for 5 minutes each. Slides were then covered with substrate chromogen solution freshly prepared by dissolving 1mg of 3,3- diaminobenzidine tetra hydrochloride (DAB) in 1ml of 0.05M Tris- HCL buffer PH 7.4 containing 1μl of H2O2. Then the slides were incubated at 22?C for 10 minutes for both till development of optimum brown colour peroxidase product. After rinsing in distilled water, sections were counterstained with Harris Haematoxylin and then mounted with coverslip using DPX as mounting media. Precautions were taken to avoid drying of tissue at any step of processing. Each batch of slides was immunostained with appropriate positive controls of sections for PSMA and Ki 67 from Prostate and breast tissue only.
The IHC staining criteria
The pathology biopsies and immunohistochemistry slides were reviewed. The pathological diagnosis was considered definite for Ki 67 when tan or brown particles in the nucleus were seen whereas for PSMA tan brown particles were seen in the cytoplasm or along the membrane. Accounting to the percentage of positive cells, Ki 67 and PSMA expression was considered positive or negative. At high magnification 10 different views were selected; for each view, 100 tumor cells were counted. The staining was considered as negative for both Ki 67 and PSMA when less than 10% cells were stained.
Statistical tests applied
Descriptive and inferential, both statistics were used. Mean and Percentage proportion was calculated of cases as per age, PSA level, histopathology typing, grading, IHC staining pattern. For categorical data, Chi square test was applied. T-test for assessing correlation. Pearson correlation coefficient ( r value) was employed to test relationships between serum PSA, Gleason score, Gleason grade, PSMA intensity , Ki 67 intensity, bone metastasis and perineural invasion. P value of <0.05 was considered as significant.
We distribute the cases in various Gleason grade groups as per serum PSA levels. Out of 8 cases of GGG 1, 4 cases had serum PSA level in between 4-10ng/ml. In GGG 2 majority of cases i.e. 20 cases had serum PSA level in between 10-50 ng/ml. GGG 3 had only 2 cases, in which 1case had serum PSA level 10-50ng/ml and another was in 50-100ng/ml. Out of 12 cases in GGG 4, maximum cases i.e. 7 had serum PSA level in between 50-100 ng/ml and 4 cases have serum PSA level > 100 ng/ml. Maximum cases of GGG 5 (3) had serum PSA level > 100 ng/ml and another one had serum PSA level between 50-100 ng/ml. On applying Chi square test statistically highly significant correlation was seen between Gleason Grade group and serum PSA level (p<0.001). On applying statistics, the correlation between Gleason grade group and perineural invasion (PNI) was statistically non-significant (p=0.133). In present study, there is no difference in presence of bone metastasis between GGG3, 4 and 5, as all have approx 50 % bone metastasis. But as the GGG increases from 1,2 to 3,4,5, presence of metastasis increases. On applying statistics between low GGG (1 & 2) and high GGG (3, 4, and 5) in relation with bone metastasis a significant correlation (p=0.01) was seen.
Out of 52 cases, maximum number of cases 32 (61.53%) showed1+ Ki 67 score followed by 17 cases (32.69%) had 2+ Ki 67 score. 2 cases (3.84%) had 3+ ki 67 score while only one patient had 4+ Ki 67 score.Out of 52 cases, 36 cases (69.2%) showed diffuse PSMA score followed by 14 cases (26.9%) had Regional PSMA score, while only 2 cases (3.8%) showed Focal PSMA score. There was no significant correlation found between age of the patients and Ki 67 and PSMA scoring. In Gleason score 6 category all cases (8) showed Ki 67 1+ expression. 28 cases belong to Gleason score 7 in which 22 cases (78.5%) show 1+ ki 67 scoring and 6 cases (21.4%) show 2+ ki 67 scoring. But in Gleason score 8 maximum cases 8 out of 12 i.e,(66.6%) show 2+ ki 67 scoring and 2(16.6%) show 3+ ki67 scoring. In Gleason score 9, 3(75%) cases show 2+ ki 67 scoring and 1(25%)case show 4+ ki 67 scoring. As per Figure 3, higher the Gleason score, the more was the expression of Ki 67 which showed high tumor aggressiveness. On applying chi-square test the relation of Gleason score to Ki 67 scoring was found to be statistically highly significant (P<0.0001). 8 cases showed Gleason score 6, out of which 05 cases (62.5%) showed diffuse PSMA expression, whereas 01 case (12.5%) and 2 cases (25%) show regional and focal PSMA expression respectively (Figure 4). The higher the Gleason score, the more was the expression of PSMA which shows high tumor aggressiveness. The P value obtained was 0.02 which was statistically significant. There was a statistically significant positive correlation between Gleason score and PSMA Ki67 intensity on applying Pearson correlation coefficient ( r value 0.1239,0.4298 respectively).
It is evident from the Figure 5 & 6 that with increasing GGG, Ki 67 proliferation and PSMA expression also increased. On distribution of cases as per GGG and Ki 67 expression, we observed that all 8 (100%) cases of GGG 1 show 1+ Ki- 67 expression. In Gleason grade group 2, 20 cases (76.9%) show 1+ ki 67 proliferation index and 6 cases (23.07%) show 2+ proliferation index. GGG 3 has only 2 cases, both shows 1+ proliferation index. In GGG 4 majority of cases i.e, 8 (66.66%) cases shows 2+ proliferation index and 2 cases (16.66%) showed 3+ ki 67 proliferation. In Gleason grade group 5 majority of cases 3 (75%) show 2+ proliferation and 1 (25%) case show 4+ Ki67 proliferation index. When Pearson chi square test was applied between Ki 67- GGG and PSMA- GGG, p value was highly significant (p = 0.0001 and 0.04 respectively). On applying T-test in between GGG and Ki 67 expression p value in between GG1 and GG3 (p=0.04), GG2 and GG3 (p=0.004), GG2 and GG5 (p=0.01) was significant (P<0.05) and comparison of other grade groups were insignificant. On applying T-test in between Gleason grade groups and PSMA expression p value in between GGG2 and GGG3 (p=0.04), GGG3 and GGG4 (p=0.03) is significant i.e, p<0.05. On applying Chi Square test statistically no significant relation was found between serum PSA levels & corresponding Ki 67 proliferative index (p= 0.08) and PSMA expression (p = 0.9). But there was a positive correlation between Gleason grade group and PSMA Ki67 intensity on applying Pearson correlation coefficient ( r value 0.0858, 0.4791 respectively).
Distribution of cases of Perineural invasion (PNI) in different PSMA and Ki 67 score as per Figure 7 & 8 , out of 2 cases in focal grade, none of the case showed PNI. While in Diffuse grade, out of 36 cases, PNI was seen in 24 cases (66.66%). When Pearson correlation test was applied, statistically significant positive correlation was seen between PSMA expression & PNI (p=0.03) while correlation between PNI and Ki 67 labelling index was not significant (p=0.41). On applying Pearson correlation coefficient, there was a strong positive correlation between PNI and PSMA Ki67 intensity ( r value 0.3504, 0.2214 respectively).
In our study, out of 52 cases, only 41 cases metastatic workup data was available. Out of 41 cases bone metastasis was present in only 11 cases. In 23 cases of Ki 67 1+ category, only 3(13%) cases showed bone metastasis. In 3+ and 4+ category, bone metastasis was present in all 100% cases (Figure 9 & 10). On applying statistics between bone metastasis and Ki 67 score a significant positive correlation was observed (p=0.01) while no significant correlation was seen between PSMA and bone metastasis (P=0.41). In our study , there was a positive correlation between bone metastasis and PSMA Ki67 intensity on applying Pearson correlation coefficient ( r value 0.1687,0.1741 respectively).
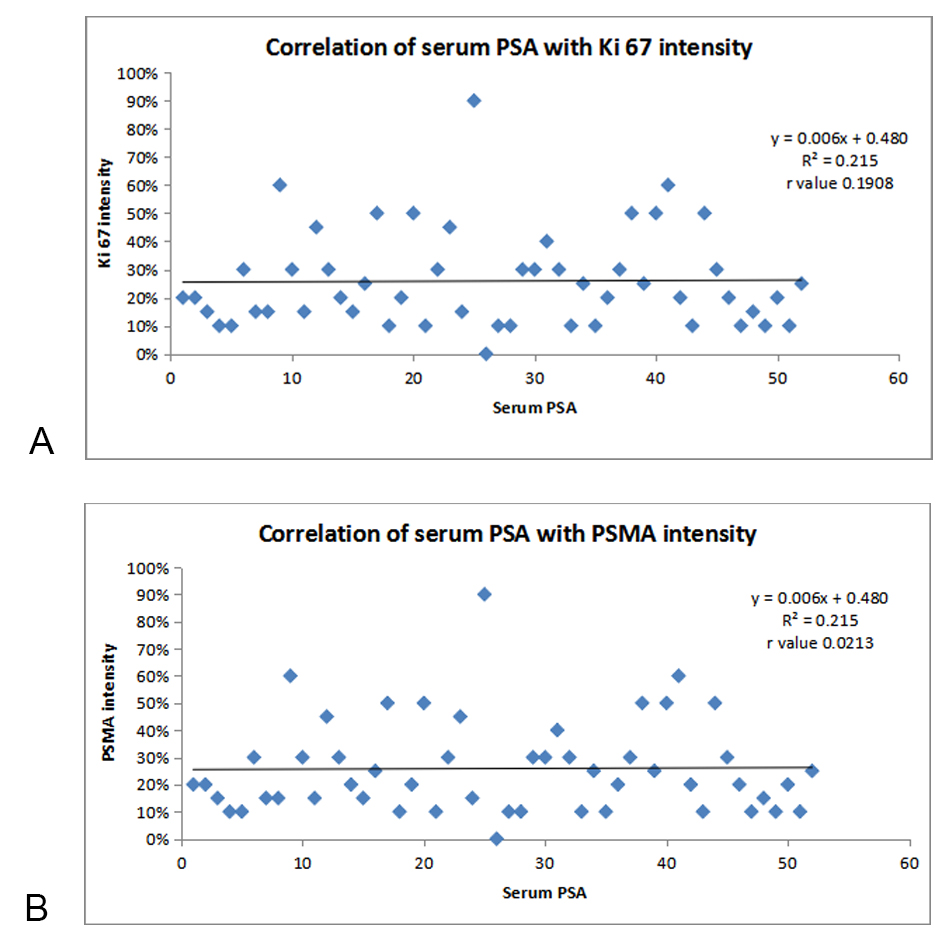 Figure 1A. Correlation of SERUM PSA with Ki 67 intensity; Figure 1B. Correlation of SERUM PSA with PSMA intensity.
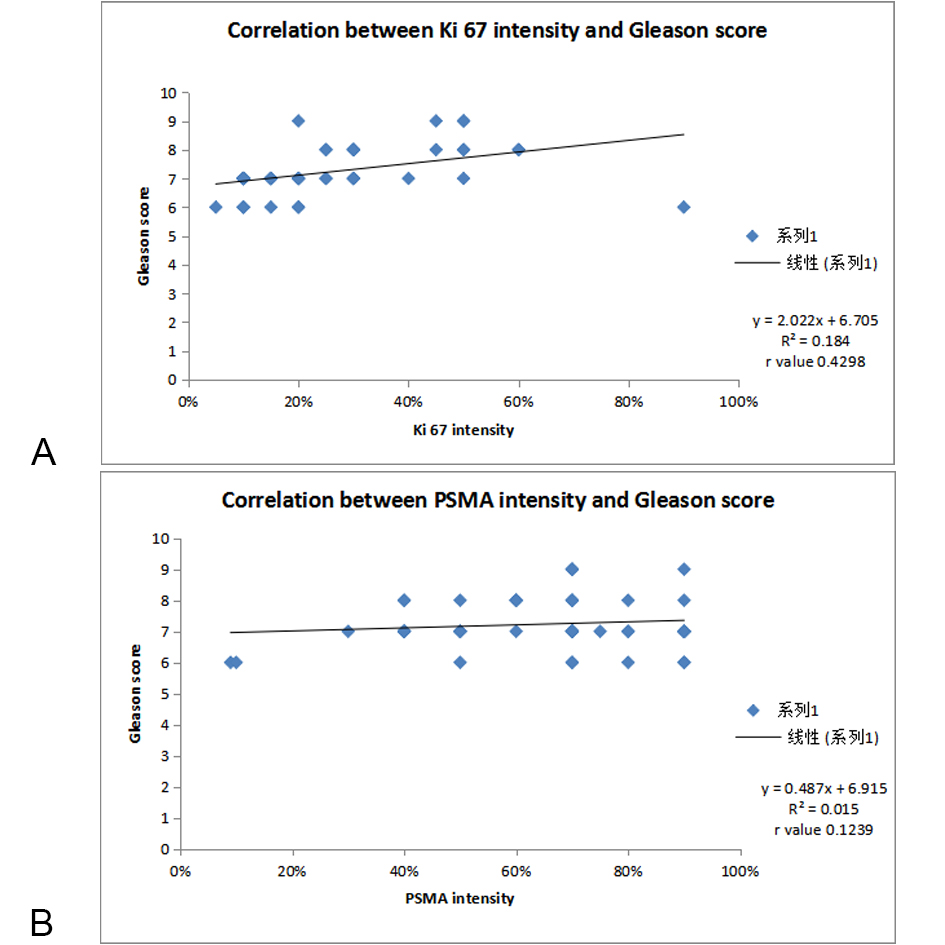 Figure 2A. Correlation of Ki 67 scoring with Gleason score; Figure 2B. Correlation of PSMA scoring with Gleason score.
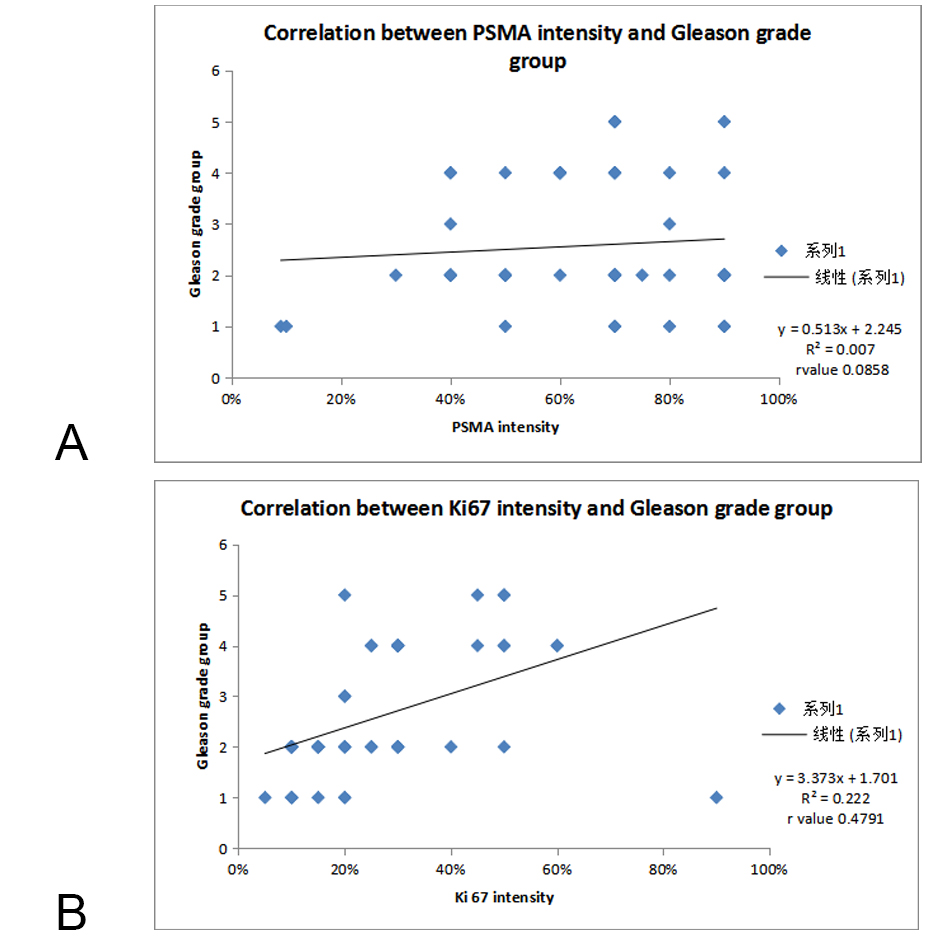 Figure 3A. Correlation of PSMA scoring with Gleason grade group; Figure3B. Correlation of Ki 67 scoring with Gleason grade group.
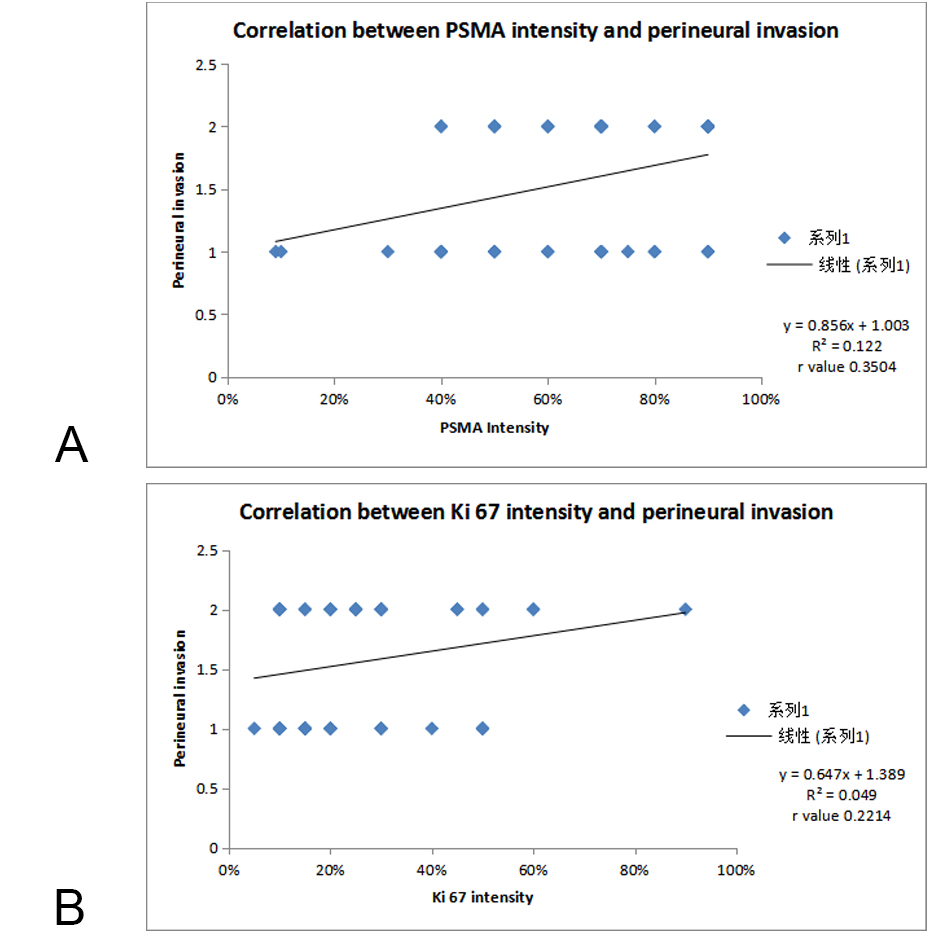 Figure 4A. Correlation of PSMA scoring with PNI; Figure 4B. Correlation of Ki 67 scoring with PNI.
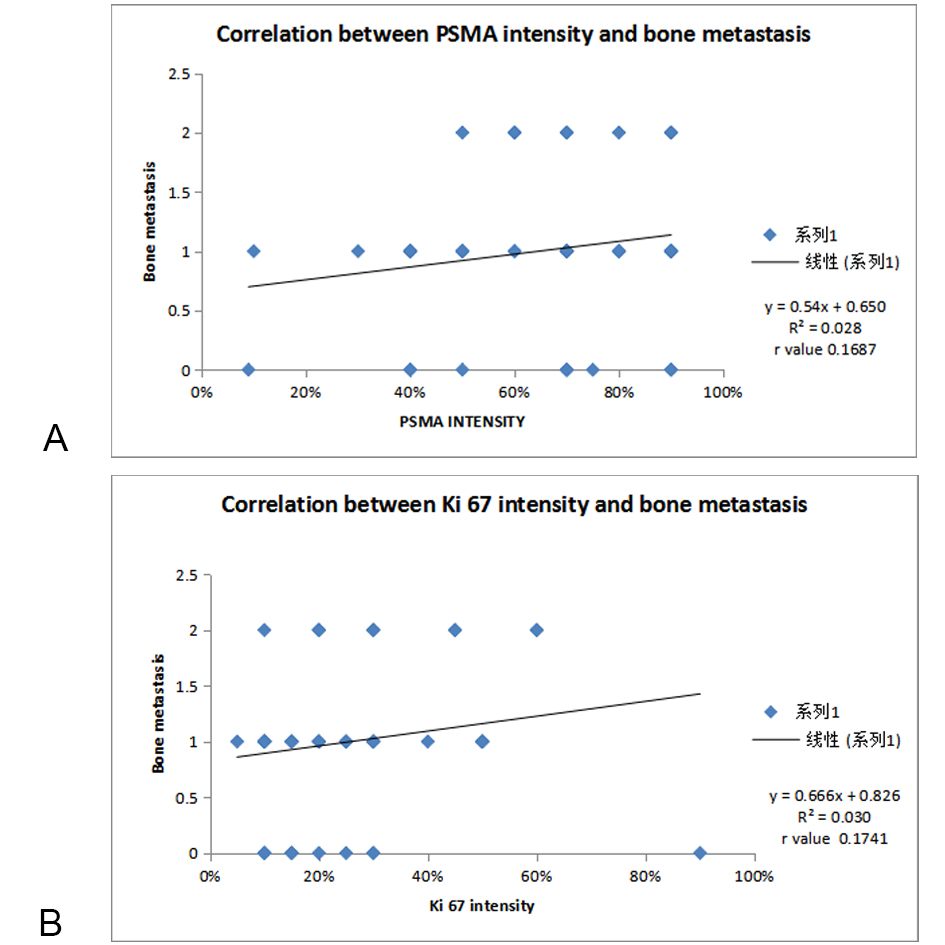 Figure 5A. Correlation of PSMA scoring with bone metastasis; Figure 5B. Correlation of Ki 67 scoring with bone metastasis.
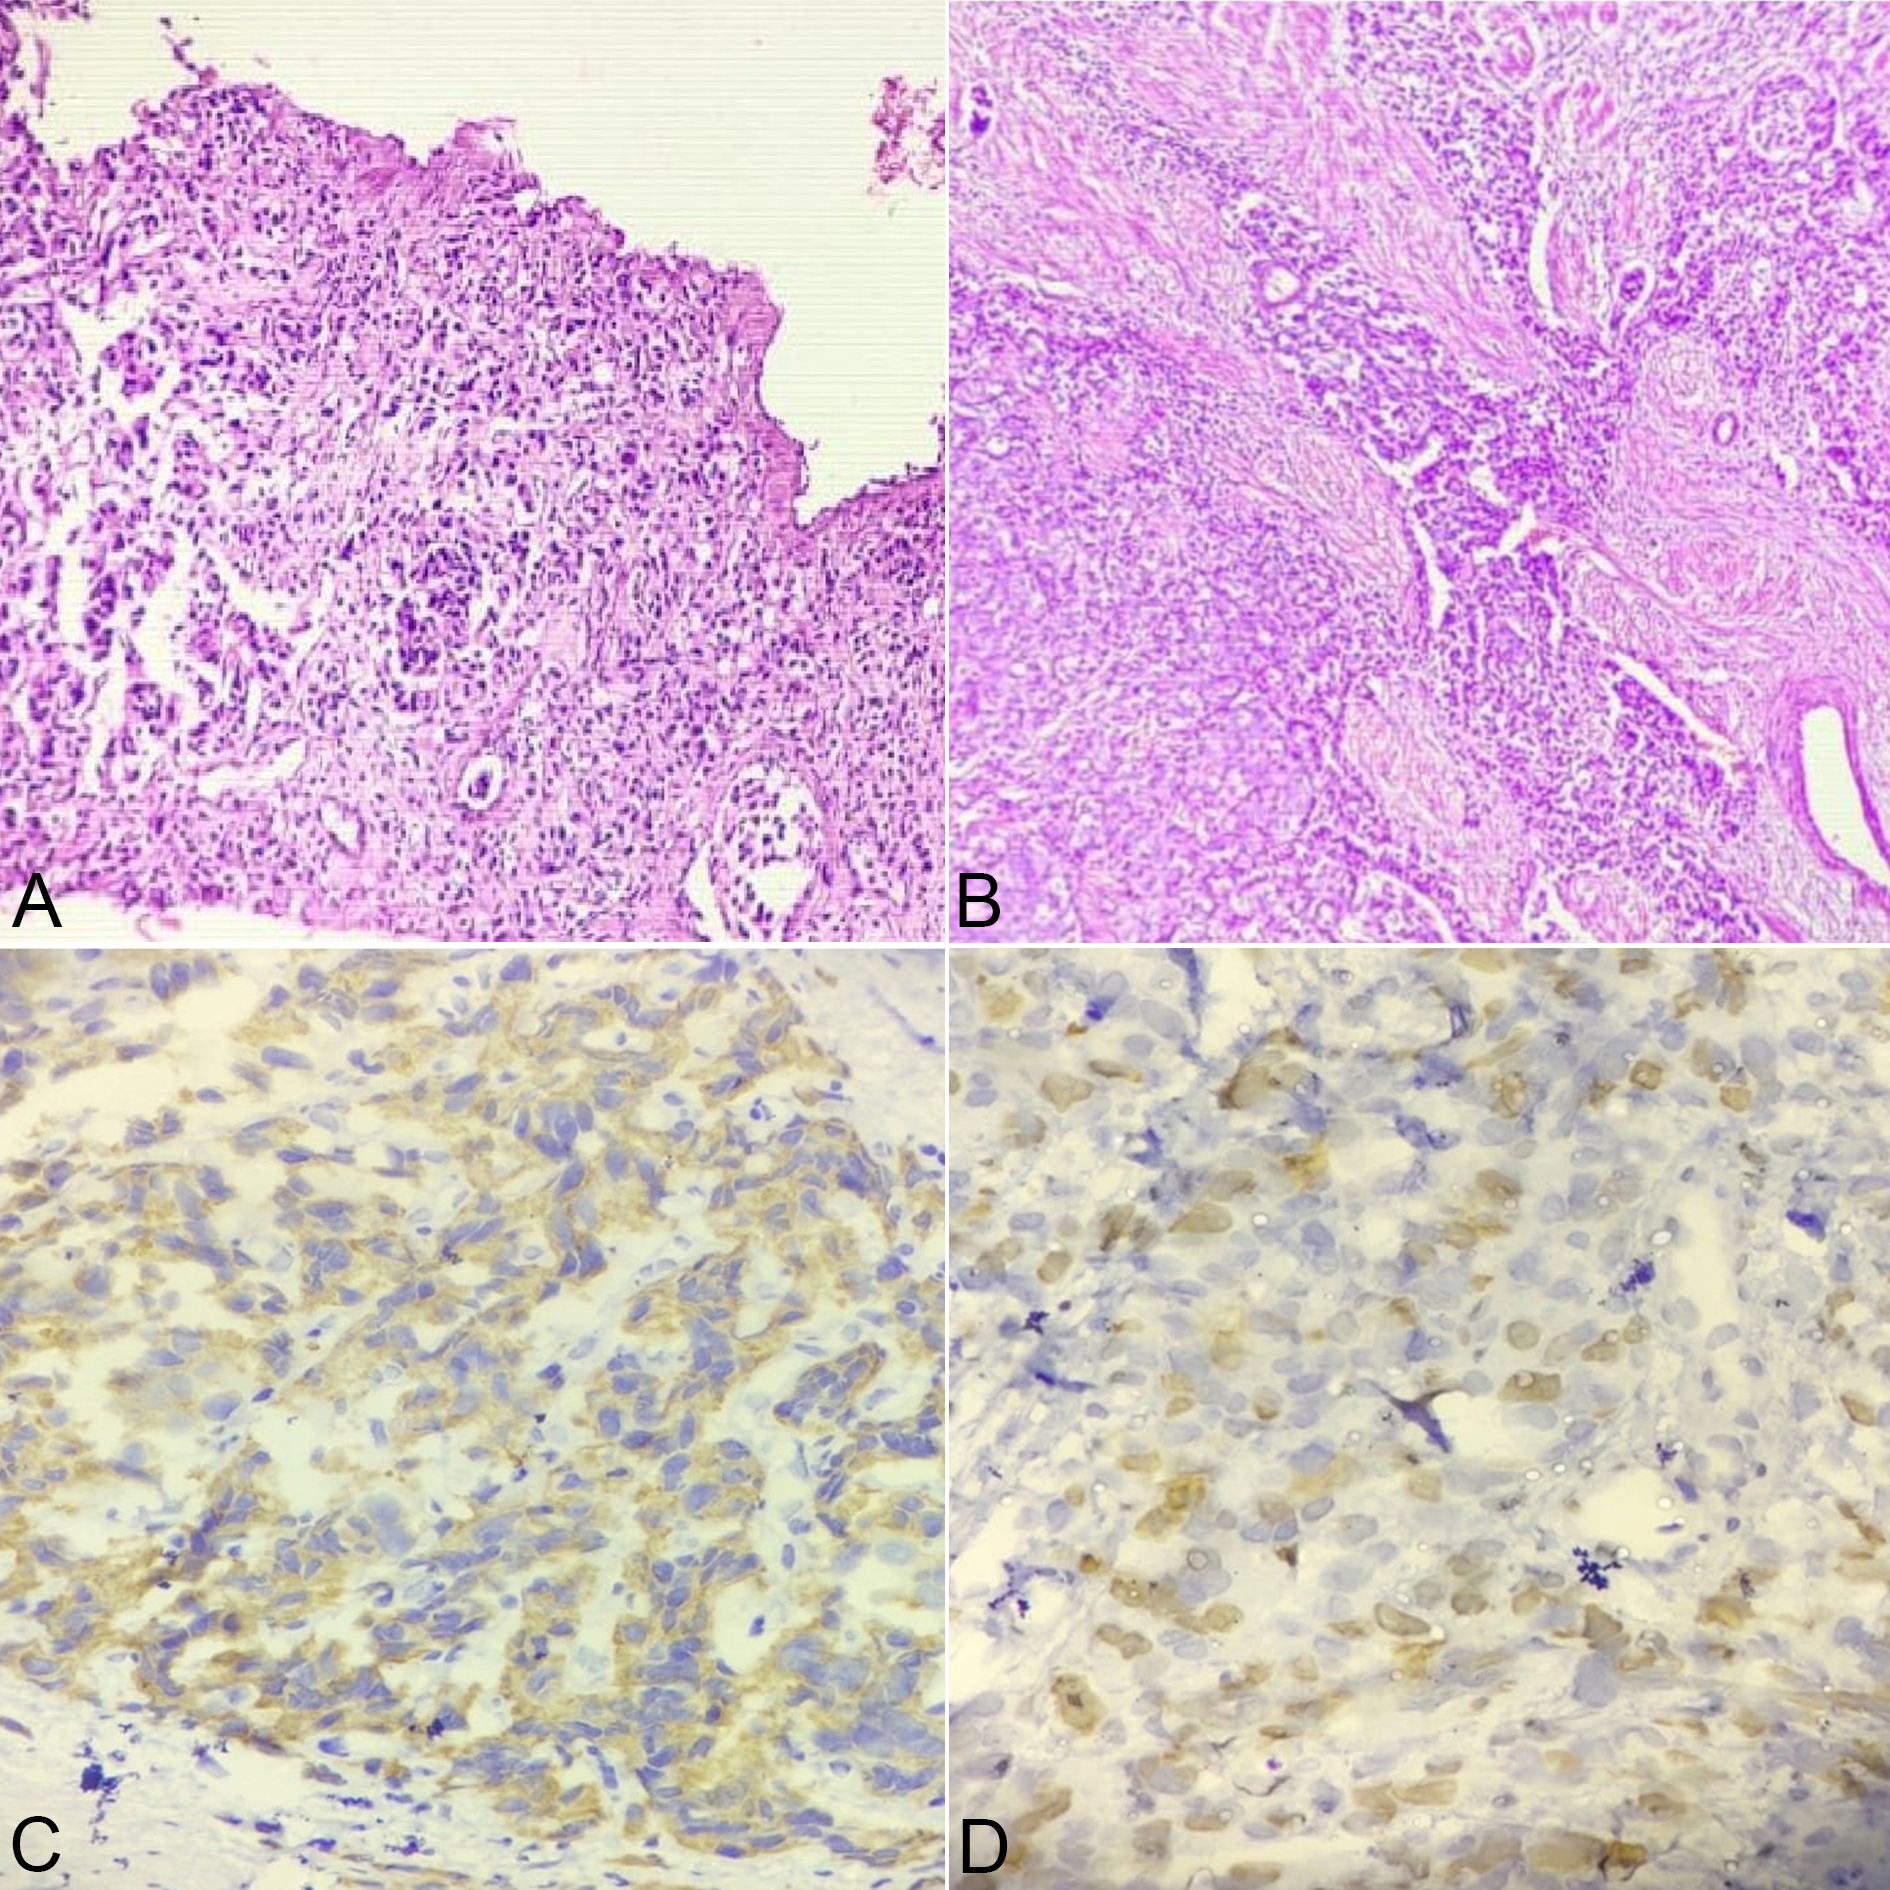 Figure 6A. Microphotograph showing sheets and acini (Gleason score 5+3) arrangement in Prostatic Adenocarcinoma at 10X view; Figure 6B. Microphotograph showing sheets and cribriform pattern (Gleason score 5+4) in Prostatic Adenocarcinoma at 10X view; Figure 6C. Microphotograph showing Diffuse PSMA expression in high Gleason grade group at 40X view; Figure 6D: Microphotograph showing High (4+) Ki 67 expression in High Gleason grade group at 40x view.
|
Table 1. Clinical characteristics of patients. (N = 52). |
||
|
Parameters |
Data |
|
|
Age (years) (mean /min–max) (SD) |
67.9 (48–87) 9 |
|
|
Symptoms - Acute urinary retention (most common) |
26 |
|
|
PSA (ng/mL) (mean /min–max) |
50.10 (4.44 – 115) 33.8 |
|
|
BMI (kg/m2) (mean /min–max) |
25.9 ( 17.9 – 42.2 ) 2.28 |
|
|
PV (mL) (mean /min–max) |
46.0 (19 – 107) 17.6 |
|
|
Perineural invasion(n) |
29 |
|
|
Bone metastasis (n) |
11 |
|
|
PSMA scoring |
Focal |
2 |
|
Regional |
14 |
|
|
Diffuse |
36 |
|
|
Ki 67 scoring |
1+ |
32 |
|
2+ |
17 |
|
|
3+ |
2 |
|
|
4+ |
1 |
|
|
Gleason score |
6 |
8 |
|
7 |
8 |
|
|
8 |
12 |
|
|
9 |
4 |
|
|
Gleason grade group |
1 |
8 |
|
2 |
26 |
|
|
3 |
2 |
|
|
4 |
12 |
|
|
5 |
4 |
|
|
Histopathological grade of tumor |
High |
16 |
|
Intermediate |
27 |
|
|
Low |
9 |
|
|
PV: prostate volume; BMI: body mass index; PSA: prostate-specific antigen; SD: standard deviation. |
||
|
Table 2. Comparison of PSMA expression in the present study with various other Studies. |
|||||
|
Study |
Year |
PSMA positive cases |
Focal |
Regional |
Diffuse |
|
Jeffrey S. Ross et al[47] |
2003 |
100% |
52% |
48% |
0% |
|
Tomomi Kusumi et al[46] |
2008 |
100% |
0% |
11.90% |
88% |
|
Kurt D Bernacki et al[48] |
2013 |
87.25% |
6.25% |
0% |
81.25% |
|
Tsouralaki Marie et al[49] |
2015 |
97.60% |
22.20% |
29.50% |
45.90% |
|
Sara Bravaccini et al [44] |
2018 |
89.80% |
11.25% |
45.79% |
32.70% |
|
Marie CHupe et al[45] |
2019 |
87% |
41.90% |
33.70% |
11.40% |
|
Present Study 2020
|
2020 |
100% |
3.80% |
26.90% |
69.20% |
|
Table 3. Comparison of Ki 67 expression in the present study with various other Studies. |
|||||||
|
Study |
Year |
Ki 67 Positive Cases |
1+ |
2+ |
3+ |
4+ |
|
|
R Urs AN et al[52] |
2008 |
72% |
54% |
12.00% |
4% |
2% |
|
|
Madani SH et al[18] |
2011 |
71% |
48.90% |
12.20% |
4.08% |
6.12% |
|
|
G Fischer et al[32] |
2013 |
81.90% |
- |
- |
- |
- |
|
|
Verma R et al[37] |
2015 |
64.00% |
30.00% |
26.00% |
8.00% |
0% |
|
|
K S Mahadev et al[53] |
2018 |
100.00% |
12% |
85.00% |
0% |
3% |
|
|
SidharthGangwar et al[23] |
2020 |
66.65% |
29.62% |
25.92% |
0% |
11.11% |
|
|
Present Study 2020 |
2020 |
100% |
61.53% |
32.69% |
3.84% |
1.92% |
|
|
Table 4. Conclusion of various studies related to correlation between Ki67 expression and Gleason score. |
||
|
Study |
No. of cases |
Conclusion |
|
M.Tsuji et al[54]1998 |
79 |
Ki67 labelling index increased with increasing grade. Mean Ki67 LI for Gleason score 2-6 was11.6% and patients with score 8-10 had LI of 24.7 |
|
Munoz E et al 2003[55] |
35 |
No statistically significant differences between the immunolabeling for Ki-67 and Gleason’s score |
|
Aaltomma et al 2006[56] |
211 |
Positive correlation between Ki67, pT and differentiation of tumours |
|
Mesko et al 2013[36] |
77 |
Ki67 labelling index was significantly different for Gleason scores of 6,7,and ≥8, (P = 0.01) |
|
Verma et al 2015[37] |
60 |
Statistically significant correlation between Ki 67 positivity and increased Gleason’s grade (P=0.002) |
|
Present study 2020 |
52 |
Highly significant correlation between Ki 67 expression and Gleason score (p value < 0.0001) |
Israeli R.S. 1994, Cunha AC 2006, Bostwick et al proposed that PSMA is a type II transmembrane glycoprotein marker in many cancers, including Prostate cancer. Colombatti M et al have shown that high PSMA expression activates signaling pathways that promote tumor cell survival and proliferation. Chang S.S.et al and Sweat SD et al have concluded that increased PSMA expression in prostate cancer is associated with higher tumor grade and a high risk of disease progression. Sara Bravaccini andMarie Christine Hupe et al in 2019 indicated that, detection of PSMA expression can serve as a powerful tool for the diagnosis of prostatic cancer and is an independent prognostic marker on biopsies at time of initial diagnosis and can predict disease recurrence following curative therapy for Prostate cancer [41-45]. In the present study, the percentage of PSMA expression positive cases was 100% (52/52), which was similar to studies by Tomomi Kusumi et al, Jeffrey S. Ross et al. Different frequencies of PSMA expression prostatic carcinomas reported in various studies could be due to geographic variation and various PSMA marker used for IHC staining [46-47]. In the present study, diffuse PSMA expression was more common(69.2%) similar to the studies done by Tomomi Kusumi et al, Kurt D Bernackiet al, Tsouralaki Marie et al whereas, it did not match with the findings of Sara Bravaccini et al, Marie Cristine Hupe and Jeffrey S. Ross et al [47-49] [Table 2]. In our study, the PSMA expression in Prostatic adenocarcinoma cases was compared with clinicopathologic parameters like age, serum PSA level, Gleason score and Gleason Grade Group (ISUP) and histological features like perineural invasion and presence of metastasis. There was no statistically significant relationship between the expression of PSMA and age. This was in concordant with the study of Sara Bravaccini et al and Alberto et al. In contrary to this, Julie L. et al. in his study found positive correlation between PSMA expression and age. Furthermore, the correlation of PSMA expression was significant (p value 0.02) with the Gleason score of the tumor, which was at par with the finding of Sara Bravaccini et al, George L Wright et al, Jeffery S Ross et al, Sven Perner et al, Julie L. et al. With increasing Gleason score, the PSMA expression increased significantly with highest PSMA expression in high Gleason score. The correlation was also significant (p value 0.04) with the Gleason Grade Group. With increasing Gleason Grade Group of tumor from 1 to 5 the PSMA expression also increased significantly with 100 % cases in GGG5 showed diffuse PSMA expression. The correlation between PSMA expression and serum PSA level (p value 0.08) was statistically insignificant. In this study, diffuse PSMA expression was equally more common in all categories of cases as per serum PSA level. This finding is similar to the finding of Jia-Qiang Ren et al, and Alberto et al. The difference in the results can be because of the difference of the staining procedure of PSMA as well as the difference in sample size and specimen type of the study [47] [51] [44] [45] [38] [50]. In the recent few years, the focus has been on the assessment of the tumor cell kinetics, since as it can reflect the degree of tumor aggression. High Ki 67 index has recently been correlated with poor clinical outcome in many malignancies. In the present study, Ki 67 was positive in 100% (52/52) cases similar to K S Mahadev et al. Our finding were discordant with study of Verma R et al and R Urs AN et al (64%, 72%, ) [Table 3]. Different frequencies of Ki 67 positive cases reported in various studies could be due to geographic variation and various Ki 67 antibodies used for staining. In the present study 1+ Ki 67 expression was more common (61.53%) , this observation was similar to the studies done by Madani SH et al (48.9%), R Urs AN et al (54%) and Verma R et al (30%) [18] [32] [37] [52] [53].
We correlated Ki 67 expression in Prostatic adenocarcinoma cases with clinicopathologic parameters like age, serum PSA level, Gleason score and Gleason Grade Group (ISUP) and histological features like perineural invasion and presence of metastasis. There was no statistically significant relationship observed between the expression of Ki 67 expression and age. This was in concordant with the study of Solène-Florence Kammerer-Jacquet [40]. Furthermore, the correlation of Ki 67 expression was highly significant (p value <0.0001) with the Gleason score of the tumor, which was at par with the finding of studies shown in Table 4. With increasing Gleason score the Ki 67 expression increased significantly. Whereas Munoz E et al, did not found any significant correlation with Ki67 and Gleason score [18] [36-37] [54-56]. The correlation was also significant (p value 0.0001) with the Gleason Grade Group and insignificant with serum PSA level.
Pretreatment serum PSA levels are a prognostic marker and stratify patients into differing prognostic categories. In present study, the correlation between Ki 67expression and serum PSA level (p value 0.9) was statistically insignificant. This finding is in concordance with the finding of Rugwizangoga B, Cowen D, Sulik M .On contrary to this Luczynska E et al and Mahadev K S et al, observed positive correlation between serum PSA and Ki 67 expression. The difference in the results can be because of the difference of the staining procedure of Ki 67 as well as the difference in sample size and specimen type of the study [53] [57-59]. Prostate cancer has a propensity to invade and grow along nerves, a phenomenon called perineural invasion (PNI). Recent studies suggest that the presence of PNI in prostate cancer has been associated with cancer aggressiveness. In the present study, PNI was present in 29 (55.7%) cases and was absent in 23 (44.2%) cases similar to the study of Lorenzo Masieri et al, (65.7% ). Contrary to this Elin Richardson et al(25%). The difference in the occurrence of PNI can be attributed to the fact that cases having more number of well differentiated tumors have low percentages of evidence of PNI while studies with more number of high grade tumors have higher percentages of evidence of PNI. Our study has significant number of cases with higher Gleason grade and high serum PSA level [39] [53]. We also correlate PNI with Ki67 labeling index and PSMA expression. In our study, we did not observe significant correlation between Ki67 and PNI whereas statistically significant correlation was present between PSMA and PNI (p=0.03). We did not found any literature related to such correlation between PNI with Ki 67 and PSMA so that comparison with other study was not possible here. In our study, we found PNI was more commonly present in cases of higher GGG but there was no statistically significant (p=0.133) correlation. Our observation did not matched with studies done by Hwang Gyun Jeonet al, F Ozcan, Jun Taik Lee et al.
Furthermore, out of 52 cases, data related to metastatic workup was available in only 41 cases. Out of 41 cases bone metastasis was present in only 11(26.8%) cases and absent in 30(73.1%) cases. This finding is discordant with those of previous studies by Ito et al and Atausetalin in which bone metastasis was present in 36.1% and 24% cases respectively. On contrary to this Oesterling et al, Zaman et al and Wolff et al reported very less incidence of bone metastasis (0.8%, 12.6% and 11.2% respectively). This high number of bone metastasis could be due to several reason like most of patients come with advance stages, majority of the patients came with high PSA and intermediate or high Gleason score at diagnosis [60-64] [41] [29]. In our study, we observed statistically significant correlation between Ki67 and bone metastasis (p=0.01) and it is evident that higher the Ki 67 labelling index, the more was the presence of bone metastasis. Whereas there was no significant correlation present between bone metastasis and PSMA expression (p=0.41). We did not found any literature related to such correlation between bone metastasis with Ki 67 and PSMA so that comparison with others studies was not possible here.
There was positive correlation between Serum PSA, Gleason score, Gleason grade group, Bone metastasis, PNI and PSMA – Ki 67 intensity on applying pearson correlation. Our findings are in agreement with results from studies carried out by other researchers [65-66].
Limitation of our study is retrospective and prospective data, not able to follow up the patients and the relatively small sample size due to time constraints. Therefore large randomised trials should be conducted to support our data. In 1970s , PSA was discovered and today it remains the most widely used biomarker in prostate carcinoma. The search for a more rapid, specific marker for detection of prostate carcinoma has lead to numerous laboratories examining biomarkers. Although a number of markers have been acknowledged, there is yet to be one that is widely accepted and used. Researches are now more concentrated on genomic markers which are beyond our study scope.
We extend our sincere thanks to the patient who participated in the study.
Ethical policy
Approval from institutional ethical committee was taken.
Author contributions
AVV & KM – they supervise the whole study,and helps in Critical Review; SJ & PK Conception, Design, Materials, Data collection; SD & BS Writing, Analysis and Interpretation,Literature Review, Drafting of manuscript. All authors read and approved the final manuscript.
Competing interests
All authors declare no competing interests.
Funding
This study was financially not supported by any institution.
- Ferlay J, Shin HR, Bray F: International Agency for Research on Cancer. GLOBOCAN 2008, Cancer Incidence and Mortality Worldwide: IARC Cancer Base 2010.
- Sung H, Ferlay J, Siegel RL, Laversanne M, Soerjomataram I, Jemal A, Bray F: GLOBOCAN estimates of incidence and mortality worldwide for 36 cancers in 185 countries. Ca Cancer J Clin 2021, 71(3): 209-249.
- Ferlay J, Colombet M, Soerjomataram I, Mathers C, Parkin DM, Piñeros M, Znaor A, Bray F: Estimating the global cancer incidence and mortality in 2018: GLOBOCAN sources and methods. Int Journal of cancer 2019, 144(8): 1941-1953.
- Burton JL, Oakley N, Anderson JB: Recent advances in the histopathology and molecular biology of prostate cancer. BJU Int 2000, 85(1): 87-94.
- Moyer VA, Force USPST: Screening for prostate cancer: U.S. preventive services task force recommendation statement. Ann Intern Med 2012, 157(2): 120-134.
- Garisto JD, Klotz L: Active surveillance for prostate cancer: how to do it right. Oncology 2017, 31(5): 333-340.
- Gleason DF, Mellinger GT: Prediction of prognosis for prostatic adenocarcinoma by combined histological grading and clinical staging. J Urol 1974, 111(1): 58-64.
- Gordetsky J, Epstein J: Grading of prostatic adenocarcinoma: current state and prognostic implications. Diagn Pathol 2016, 11: 25.
- van den Bergh RC, Roemeling S, Roobol MJ, Aus G, Hugosson J, Rannikko AS, Tammela TL, Bangma CH, Schröder FH: Outcomes of men with screen-detected prostate cancer eligible for active surveillance who were managed expectantly. European Urology 2009, 5(1): 1-8.
- Egevad L, Ahmad AS, Algaba F, Berney DM, Boccon-Gibod L, Compérat E, Evans AJ, Griffiths D, Grobholz R, Kristiansen G, et al: Standardization of Gleason grading among 337 European pathologists. Histopathology 2013, 62(2): 247-256.
- McKenney JK, Simko J, Bonham M, True LD, Troyer D, Hawley S, Newcomb LF, Fazli L, Kunju LP, Nicolas MM, et al: The potential impact of reproducibility of Gleason grading in men with early stage prostate cancer managed by active surveillance: a multiinstitutional study. J Urol 2011, 186(2): 465-469.
- Jakobsen NA, Hamdy FC, Bryant RJ: Novel biomarkers for the detection of prostate cancer. J Clin Urol 2016, 9: 3-10.
- McGrath S, Christidis D, Perera M, Hong SK, Manning T, Vela I, Lawrentschuk N: Prostate cancer biomarkers: are we hitting the mark? Prostate Int 2016, 4(4): 130-135.
- Sharma P, Zargar-Shoshtari K, Pow-Sang JM: Biomarkers for prostate cancer: present challenges and future opportunities. Future Sci OA 2016, 2(1): FSO72.
- Moul JW, Merseburger AS, Srivastava S: Molecular markers in prostate cancer: the role in preoperative staging. Clin Prostate Cancer 2002, 1(1): 42-50.
- Quinn DI, Henshall SM, Sutherland RL: Molecular markers of prostate cancer outcome. Eur J Cancer 2005, 41(6): 858-887.
- Israeli RS, Powell CT, Corr JG, Fair WR, and Heston WD: Expression of the prostate-specific membrane antigen. Cancer Res 1994, 54(7): 1807-1811.
- Madani SH, Ameli S, Khazaei S, Kanani M, Izadi B: Frequency of Ki-67 (MIB-1) and P53 expressions among patients with prostate cancer. Indian J PatholMicrobiol 2011, 54(4): 688-691.
- Anderson Jackson L, A McGrowder Donovan, Ruby Alexander-Lindo: Prostate specific antigen and Gleason score in men with prostate cancer at a private diagnostic radiology centre in Western Jamaica. Asian Pac J Cancer 2012: 1453-1456.
- Gurumurthy D, Maggad R, Patel S: Prostate carcinoma: correlation of histopathology with serum prostate specific antigen. Sci J Clin Med 2015, 21: 1-5.
- Deepak P, Jayapradeep, Prakash VB, Philipose TR, Pai MR: Histomorphological correlation of PSA levels in prostatic pathology. NJLM 2017: 28-32.
- William Hamilton , Deborah J Sharp, Tim J Peters, Alison P Round: Clinical features of prostate cancer before diagnosis: a population-based, case-control study. Br J Gen Pract 2006, 56 (531): 756-762.
- Gangwar S, Shukla P, Singh V and Pandey P: Expression of Ki-67 in Prostate cancers and its correlation with Histopathological Grade and serum Prostate-specific antigen (PSA) levels: A study from eastern part of Uttar Pradesh. JMSCR 2020: 295-302.
- Marchal C, Redondo M, Padilla M, Caballero J, Rodrigo I, García J, Quian J, Boswick DG: Expression of prostate specific membrane antigen (PSMA) in prostatic adenocarcinoma and prostatic intraepithelial neoplasia. Histol Histopathol 2004, 19(3): 715-718.
- Zivkovic S: Correlation between prostate-specific antigen and histopathological difference of prostate carcinoma. Arch Oncol 2004, 12(3): 148-151.
- Goswami AP, Rupala G, Nutanbala, Goswami N: Serum PSA level in Prostatic lesion with Histopathological Correlation in Gujrat. NJIRM 2011: 2(4): 33-38.
- Albasri A, El-Siddig A, Hussainy A, Mahrous M, Alhosaini AA, Alhujaily A: Histopathologic characterization of prostate diseases in Madinah, Saudi Arabia. Asian Pac J Cancer Prev 2014, 15(10): 4175-4179.
- Zhiguncao, Mengqi Xiang, Jianglei Zhang: Prognostic value of Ki-67 in patients wiyh hypertension and prostate cancer: A real world study in Chinese population: Cancer Bio: 2019.
- Zaman MU, Fatima N, Sajjad Z: Metastasis on bone scan with low prostate specific antigen (≤20 ng/ml) and Gleason’s score (<8) in newly diagnosed Pakistani males with prostate cancer: should we follow Western guidelines? Asian Pac J Cancer Prev 2011, 12(6): 1529-1532.
- Dall'Oglio MF, Crippa A, Passerotti CC, Nesrallah LJ, Leite KR, Srougi M: Serum PSA and cure perspective for prostate cancer in males with nonpalpable tumor. Int Braz J Urol 2005, 31(5): 437-444.
- Sanjaya IP, Mochtar CA, Umbas R: Correlation between Low Gleason score and prostatic specific antigen levels with incidence of bone metastasis in prostate cancer patients: when to omit bone scans? Asian Pac J Cancer Prev 2013, 14(9): 4973-4976.
- Fisher G, Yang ZH, Kudahetti S, Møller H, Scardino P, Cuzick J, Berney DM; Transatlantic Prostate Group: Prognostic value of Ki-67 for prostate cancer death in a conservatively managed cohort. British J Cancer 2013, 108(2): 271-277.
- Karnes RJ, MacKintosh FR, Morrell CH, Rawson L, Sprenkle PC, Kattan MW, Colicchia M, Neville TB: Prostate-Specific Antigen Trends Predict the Probability of Prostate Cancer in a Very Large U.S. Veterans Affairs Cohort. Front Oncol 2018, 8: 296.
- Wang GW, Shen DH: Age correlates with Gleason score in patients with prostate adenocarcinoma. Zhonghua Nan Ke Xue 2015, 21(2): 140-143.
- Kumari K, Sharma N, Asotra S, Sharad S, Sharma R, Thakuret R: Correlation between Gleason score of adenocarcinoma prostate and serum PSA levels in the western Himalayan region of India. Indian J Pathol and Oncol 2020: 223-227.
- Mesko S, Kupelian P, Demanes DJ, Huang J, Wang PC, Kamrava M: Quantifying the Ki-67 heterogeneity profile in prostate cancer.Prostate Cancer 2013, 717080: 1-5.
- Verma R, Gupta V, Singh J, Verma M, Gupta G, Gupta S, Sen R, Ralli M: Significance of p53 and Ki-67 expression in prostate cancer. Uro Ann 2015, 7(4): 488-493.
- Kasperzyk JL, Finn SP, Flavin R, Fiorentino M, Lis R, Hendrickson WK, Clinton SK, Sesso HD, Giovannucci EL, Stampfer MJ, et al: Prostate-Specific Membrane Antigen Protein Expression in Tumor Tissue and Risk of Lethal Prostate Cancer.Cancer Epidemiol Biomarkers Prev 2013, 22(12): 2354-2363.
- Richardsen E, Andersen S, Al-Saad S, Rakaee M, Nordby Y, Pedersen MI, Ness N, Grindstad T, Movik I, Dønnem T, et al: Evaluation of the proliferation marker Ki-67 in a large prostatectomy cohort. Plos One 2017, 12(11): e0186852.
- Solence F, Ahmed A, Daniel M Berney: Ki-67 is an independent predictor of prostate cancer death in routine needle biopsy samples: proving utility for routine assessments. Modern Pathology 2019, 32(9): 1038-1079.
- Wolff JM, Zimny M, Borchers H, Wildberger J, Buell U, Jakse G: Is prostatespecific antigen a reliable marker of bone metastasis in patients with newly diagnosed cancer of the prostate? Eur Urol 1998, 33(4): 376-381.
- Bostwick DG, Wollan P, Adlakah K: Collagenous micronodules in prostate cancer. A specific but infrequent diagnostic finding. Arch Pathol Lab Med 1995, 119(5): 444-447.
- Chang SS, Reuter VE, Heston WD, Bander NH, Grauer SL and Gaudin PB: Five different anti prostate specific membrane antigen (PSMA) antibodies confirm PSMA expression in tumor associated neovasculature. Cancer Res 1999, 59(13): 3192-3198.
- Bravaccini S, Puccetti M, Bocchini M, Ravaioli S, Celli M, Scarpi E, De Giorgi U, Tumedei MM, Raulli G, Cardinale L: PSMA expression: a potential ally for the pathologist in prostate cancer diagnosis. Scientific Reports 2018, 8(1): 4254.
- Hupe MC, Philippi C, Roth D, Kümpers C, Ribbat-Idel J, Becker F, Joerg V, Duensing S, Lubczyk VH, Kirfel J: Expression of Prostate-Specific Membrane Antigen (PSMA) on Biopsies Is an Independent Risk Stratifier of Prostate Cancer Patients at Time of Initial Diagnosis. Front Oncol 2018, 8: 623.
- Kusumi T, Koie T, Tanaka M, Matsumoto K, Sato F, Kusumi A, Ohyama C, Kijima H: Immunohistochemical detection of carcinoma in radical prostatectomy specimens following hormone therapy. Pathol Int 2008, 58(11): 687-694.
- Ross JS, Sheehan CE, Fisher HA, Kaufman RP Jr, Kaur P, Gray K, Webb I, Gray GS, Mosher R, Kallakury BV: Correlation of primary tumor prostate-specific membrane antigen expression with disease recurrence in prostate cancer.Clin Cancer Res 2003, 9(17): 6357-6362.
- Kurt D Bernacki, Kristina Fields, Michael H Roh: The utility of PSMA and PSA immunohistochemistry marker in detecting metastatic prostate carcinoma. Diagn Cytopathol 2014, 42(7): 570-575.
- Tsourlakis MC, Klein F, Kluth M, Quaas A, Graefen M, Haese A, Simon R, Sauter G, Schlomm T, Minner S: PSMA expression is highly homogenous in primary prostate cancer. Appl Immunohistochem Mol Morphol 2015: 449-455.
- Antunes AA, Reis ST, Leite KR, Real DM, Sousa-Canavez JM, Camara-Lopes LH, Dall'Oglio MF, Srougi M: PGC and PSMA in prostate cancer diagnosis: tissue analysis from biopsy samples. Int Braz J Urol 2013, 39(5): 649-656.
- Minner S, Wittmer C, Graefen M, Salomon G, Steuber T, Haese A, Huland H, Bokemeyer C, Yekebas E, Dierlamm J: High level PSMA expression is associated with early PSA recurrence in surgically treated prostate cancer. The Prostate 2011, 71(3): 281-288.
- RoopaUrs AN, Manjunath G V, Suchitha S, HugaraSiddalingappa: A study of p53 immunostaining in prostate carcinoma: correlation with Gleason’s score. Ann Pathol and Lab Med 2019: 49-54.
- Kanna SM, BR Vani and Srinivas MV: Histopathological Study of Prostatic Carcinoma in Relation to Gleason Grade, Serum PSA and Ki67 Immunomarker. Ann Pathol and Lab Med 2018, 697-701.
- Tsuji M, Murakami Y, Kanayama H, Sano T, Kagawa S: Immunohistochemical analysis of Ki-67 antigen and Bcl-2 protein expression in prostate cancer: effect of neoadjuvant hormonal therapy. Br J Urol 1998, 81(1): 116-121.
- Muñoz E, Gómez F, Paz JI, Casado I, Silva JM, Corcuera MT: Ki-67 immunolabeling in pre-malignant lesions and carcinoma of the prostate. Histological correlation and prognostic evaluation. Eur J Histochem 2003, 47(2): 123-128.
- Aaltomaa S, Kärjä V, Lipponen P, Isotalo T, Kankkunen JP, Talja M, Mokka R: Expression of Ki67, cyclin D1 and apoptosis markers correlated with survival in prostate cancer patients treated by radical prostatectomy. Anticancer Res 2006, 26(6C): 4873-4878.
- Luczynska E, Gasinska A, Wilk W: Expression of Ki-67 (MIB-1) and GLUT-1 proteins in non-advanced prostatic cancer. Pol J Pathol 2012, 63(4): 272-277.
- Rugwizangoga B, Vuhahula E, Kitinya J: A Combination Of Ki67 Expression And Gleason Score For Prostatic Adenocarcinoma Offers Better Prognostic Information Than Either Alone. The Internet Journal of Urology 2014, 12(1): 1-9.
- Marian Sulik, KlaudiaMaruszak, Joanna Puchalska, MagdalenaMisiukiewicz-Poć: Expression of ki-67 as a proliferation marker in prostate cancer Ppol. Ann Med 2011, 18: 12-19.
- Masieri L, Lanciotti M, Nesi G, Lanzi F, Tosi N, Minervini A, Lapini A, Carini M, Serni S: Prognostic role of perineural invasion in 239 consecutive patients with pathologically organ-confined prostate cancer. Urol Int 2010, 85(4): 396-400.
- Ozcan F: Correlation of perineural invasion on radical prostatectomy specimens with other pathologic prognostic factors and PSA failure. Eur Urol 2001, 40(3): 308-312.
- Jeon HG, Bae J, Yi JS, Hwang IS, Lee SE, Lee E: Perineural invasion is a prognostic factor for biochemical failure after radical prostatectomy. Int J Urol 2009, 16(8): 682-686.
- Lee JT, Lee S, Yun CJ, Jeon BJ, Kim JM, Ha HK, Lee W, Chung MK: Prediction of Perineural Invasion and Its Prognostic Value in Patients with Prostate Cancer. Korean J Urol 2010, 51(11): 745-751.
- Ito K, Kubota Y, Suzuki K, Shimizu N, Fukabori Y, Kurokawa K, Imai K, Yamanaka H: Correlation of prostatespecific antigen before prostate cancer detection and clinicopathologic features: evaluation of mass screening populations. Urol 2000, 55: 705-709.
- CA Okolo, Akinosun OM, Shittu OB, Olapade-Olaopa EO, Okeke LI, Akang EEU, Ogunbiyi JO: Correlation of Serum PSA and Gleason Score in Nigerian Men with Prostate Cancer. African J Urology 2008, 14: 15-22.
- Herschman JD, Smith DS,Catalona WJ: Effect of ejaculation on serum total and free prostate-specific antigen concentrations. Urology 1997, 50(2): 239-243.
Annals of urologic oncology
p-ISSN: 2617-7765, e-ISSN: 2617-7773
 Copyright © Ann Urol Oncol. This work is licensed under a Creative Commons Attribution-NonCommercial-No Derivatives 4.0 International (CC BY-NC-ND 4.0) License.