
 Submit Manuscript
Trends in Primary Kidney Cancer: A South Australian Registry Review
Richard Hoffmann1,2, Arman Kahokehr1,2,3, Michael O'Callaghan1,4, Katina D'Onise5, Darren Foreman1,2,4
1Department of Urology, Flinders Medical Centre, Adelaide, Australia.
2Department of Surgery, University of Adelaide, Adelaide, Australia.
3Department of Urology, Lyell McEwin Hospital, Adelaide, Australia.
4SA-PCOCC, Flinders Centre for Innovation in Cancer, University of Adelaide Discipline of Medicine, Adelaide, Australia.
5Prevention and Population Health Branch, SA Department for Health and Wellbeing, Adelaide, Australia.
Correspondence: Richard Hoffmann (c/o Department of Urology, Flinders Medical Centre, Bedford Park SA, 5042; Email: richard.hoffmann@sa.gov.au).
Annals of Urologic Oncology 2019, 2(1): 19-25. https://doi.org/10.32948/auo.2019.10.24
Received: 01 Sep 2019 | Accepted: 23 Oct 2019 | Published online: 05 Nov 2019 
Background The incidence of primary kidney cancer (PKC) has been increasing over the last three decades. This has been attributed to the liberal use of radiological examinations for unrelated indications. We investigated the incidence and survival trends of PKC in South Australia.
Methods Data were provided through the South Australian Cancer Registry and comprised pathology, hospital admission and death notifications between 1977- 2013. Basic demographic data at diagnosis, tumour grade, and overall survival (OS) were available for analysis.
Results During 1977-2013 there were 5529 cases of PKC diagnosed. Mean overall survival was 70.6 months (standard deviation 80.2). The age adjusted incidence of PKC has increased from 5 per 100,000 to 12.7 per 100,000. However, CSS and OS has significantly improved at each decade of diagnosis since 1977 (p<0.001).
Conclusion Since 1977 the incidence of kidney cancer has doubled in South Australia with step-wise improvement in OS at each decade of diagnosis.
Key words primary kidney cancer, survival, incidence, state registry
The rise in incidence of PKC is thought to be multifactorial. Higher rates of PKC are seen in European and North American countries compared to Asia and South America [3] and increasing by approximately 3% annually without a clearly identified reason [4]. Recent data within the Australian population have linked overweight and obesity to PKC [5] as well as the previously established risk factors (excluding genetic and familial diseases) of increasing age, tobacco smoking, hypertension, and asbestos exposure [5]. However, the most significant cause for the increasing incidence of PKC is thought to be the liberal use of radiological exams for unrelated conditions, which has been reported to account for 50% of new diagnoses [6]. It has been postulated that these cancers would have otherwise gone un-diagnosed [7]. Whether this increase in incidence represents merely a surveillance effect or a true increase in incidence remains to be seen. Whilst the average size of PKC has decreased at diagnosis, the earlier detection and treatment has shown little improvement in survival in patients with larger tumours [4, 8, 9].
Therefore, to aid health service planning we aimed to describe the epidemiology of primary kidney cancer, in particular trends in incidence and mortality within South Australia.
Cancer registry
The South Australian Cancer Registry has been in operation since 1977, and covers the geographical area of South Australia, a state which currently has a population of 1.7 million people. Notification of all invasive cancer diagnoses to the registry is mandated by law. Primary site of cancer and morphology are coded for each case using ICD-O-3. The registry also codes date at diagnosis, age at diagnosis, grade at diagnosis, gender, place of residence at diagnosis and death events (including cause). Death events are determined through notification from the state Births, Deaths and Marriages registry on a monthly basis and through probabilistic linkage with the national death index biannually to identify interstate deaths.
The Cancer Registry has a number of processes that enhance data quality including multiple source notification per case, active follow up of pathology for every case, electronic reporting, annual de-duplication procedures and active follow up of all death certificate only notifications. Case coding is standardised and supported by the Registry Plus software system that includes a series of validation checks that report in real time possibly inconsistent information such as sex/cancer combinations, morphology/topography combinations, age/cancer combinations so that they may be corrected before the case reaches the database.
Statistical analysis
The South Australian Cancer Registry provided data relating to all patients diagnosed between 1977 and 2013. The ICD coded cancer type C64 (kidney) was eligible for inclusion.
Incidence was reported a) as a crude count per annum, b) as a crude rate per 100,000, and c) as age standardised incidence using the direct method and the 2011 Australian Standard Population. State population data were sourced from the Australian Bureau of Statistics. Survival analysis was conducted using multivariable Cox proportional hazards modelling and assessed overall survival and cancer specific survival. Survival was measured from the date of diagnosis until the date of death or censoring. The censor date was the 31st December 2013. Survival trends were stratified into four, seven year groups except in multivariable analysis. Confounding factors in the model included: age at diagnosis, gender, year of diagnosis, grade, area of residence at diagnosis (metropolitan or rural) and Socio-Economic Indexes for Areas (SEIFA) Quintile (socio-economic status has been shown to be associated with varying degrees of obesity and cardiovascular risk factors, such as hypertension and smoking status). Missing data and unclassifiable data were excluded from further analysis. The SEIFA index was developed by the Australian Bureau of Statistics and ranks areas in Australia according to relative socio-economic advantage and disadvantage. The 2011 index was used in this analysis. Kaplan Meir plots were used to graphically represent survival. Joinpoint analysis was used to assess changes in incidence between 1977 and 2013. The Annual Percent Change was calculated using a maximum of 5 join points and p-value of less than or equal to 0.05 deemed significant. Analysis was conducted using Joinpoint Regression Program, Version 4.5.0.1. June, 2017; Statistical Research and Applications Branch, National Cancer Institute. This study was reviewed and approved by the Southern Adelaide Clinical Human Research Ethics Committee.
Between 1977 and 2013, there were 5529 patients identified as having primary kidney cancer within South Australia. Basic demographic factors and mean overall survival (OS) data are presented in Table 1. During this time the age standardised incidence of primary kidney cancer has been steadily increasing from 5.28 per 100,000 in 1977 to 13.31 per 100,000 in 2013. This increase can be seen both as crude incidence per 100,000 and after age standardisation (Figure 1). Joinpoint analysis was performed and found that in the years from 1976 to 2001 the rate of increase per annum was 3.39% (p < 0.05) (Figure 2). However from 2001 to 2013 the increase in incidence was only 0.8%, representing a statistically insignificant change (p > 0.05). Within South Australia, PKC has the fastest increase in incidence when compared to other common urological cancers.
Cancer specific survival improves with year of diagnosis (HR 0.989, 95% CI 0.981-0.995, p < 0.001) (Figure 3a). Cancer specific survival was worse in older patients (HR 1.02, 95% CI 1.01-1.03, p < 0.001). However, from the years where data on grade was collected, no clear grade showed a greater improvement in survival (Figure 3b) with grade incidence also remaining stable (Figure 3c). Overall survival (OS) has been improving at each decade of diagnosis (P < 0.001) (Figure 4). Five and ten year OS for the entire cohort is 54% (95% CI 0.53 - 0.56) and 40% respectively (95% CI 0.39 - 0.42). Based on pathological cancer grade and after adjustment for survival trends, stratification into four cohorts of seven year periods shows an improvement in survival with each subsequent cohort (Table 2). In multivariable analysis, age, male gender, increasing grade, and metropolitan patients were all associated with poorer survival. Those diagnosed in later years were found to have improved survival. Survival in those from a lower socio-economic area was no different than those from higher socio-economic groups.
|
Table 1. Demographics of Primary Kidney Cancer in South Australia 1977-2013 (n=5529). |
|
|
|
PKC N (%) |
|
Age in years (%) |
|
|
<50 |
773 (14.0) |
|
50-75 |
3352 (60.6) |
|
>75 |
1404 (25.4) |
|
Year of Diagnosis (%) |
|
|
1977-1984 |
573 (10.9) |
|
1985-1994 |
1053 (20.0) |
|
1995-2004 |
1781 (33.9) |
|
2005-2012 |
1851 (35.2) |
|
Cancer grade (%) |
|
|
1 |
387 (7.0) |
|
2 |
1128 (20.4) |
|
3 |
700 (12.7) |
|
4 |
180 (3.3) |
|
Missing |
3124 (56.5) |
|
Males (%) |
3615 (65.4) |
|
Females (%) |
1913 (34.6) |
|
Rural Patients |
1347 (24.4) |
|
SEIFA quartile (%) |
|
|
1 |
1188 (21.5) |
|
2 |
1156 (20.9) |
|
3 |
1143 (20.7) |
|
4 |
1020 (18.5) |
|
5 |
1015 (18.4) |
|
Mean survival months (sd) |
70.6 (80.2) |
|
Median survival (months) |
42 |
|
Cancer Grade 6 = unable to be assigned a grade by reporting pathologist; SEIFA: Socio-Economic Indexes For Areas |
|
|
Table 2. Predictors of Survival. |
|||
|
Items |
Subgroup |
HR (95% CI) |
P Value |
|
Age at Diagnosis |
|
1.05 (1.05-1.05) |
<0.001 |
|
Sex |
Female |
ref |
|
|
Male |
1.14 (1.06-1.22) |
0.001 |
|
|
Year of Diagnosis |
|
0.98 (0.98-0.99) |
<0.001 |
|
Grade |
1 |
ref |
|
|
2 |
1.27 (1.00-1.62) |
0.051 |
|
|
3 |
2.26 (1.77-2.88) |
<0.001 |
|
|
4 |
3.85 (2.87-5.15) |
<0.001 |
|
|
6 |
3.63 (1.76-7.5) |
0.001 |
|
|
Region |
Missing |
3.32 (2.66-4.2) |
<0.001 |
|
Metro |
ref |
|
|
|
Rural |
1.11 (1.01-1.21) |
0.029 |
|
|
SIEFA Quintile |
1 |
ref |
|
|
2 |
0.98 (0.88-1.09) |
0.648 |
|
|
3 |
0.94 (0.84-1.04) |
0.23 |
|
|
4 |
0.95 (0.85-1.07) |
0.387 |
|
|
5 |
0.94 (0.84-1.06) |
0.3 |
|
|
SEIFA quintile 1 most disadvantaged, SEIFA 5 most advantaged |
|||
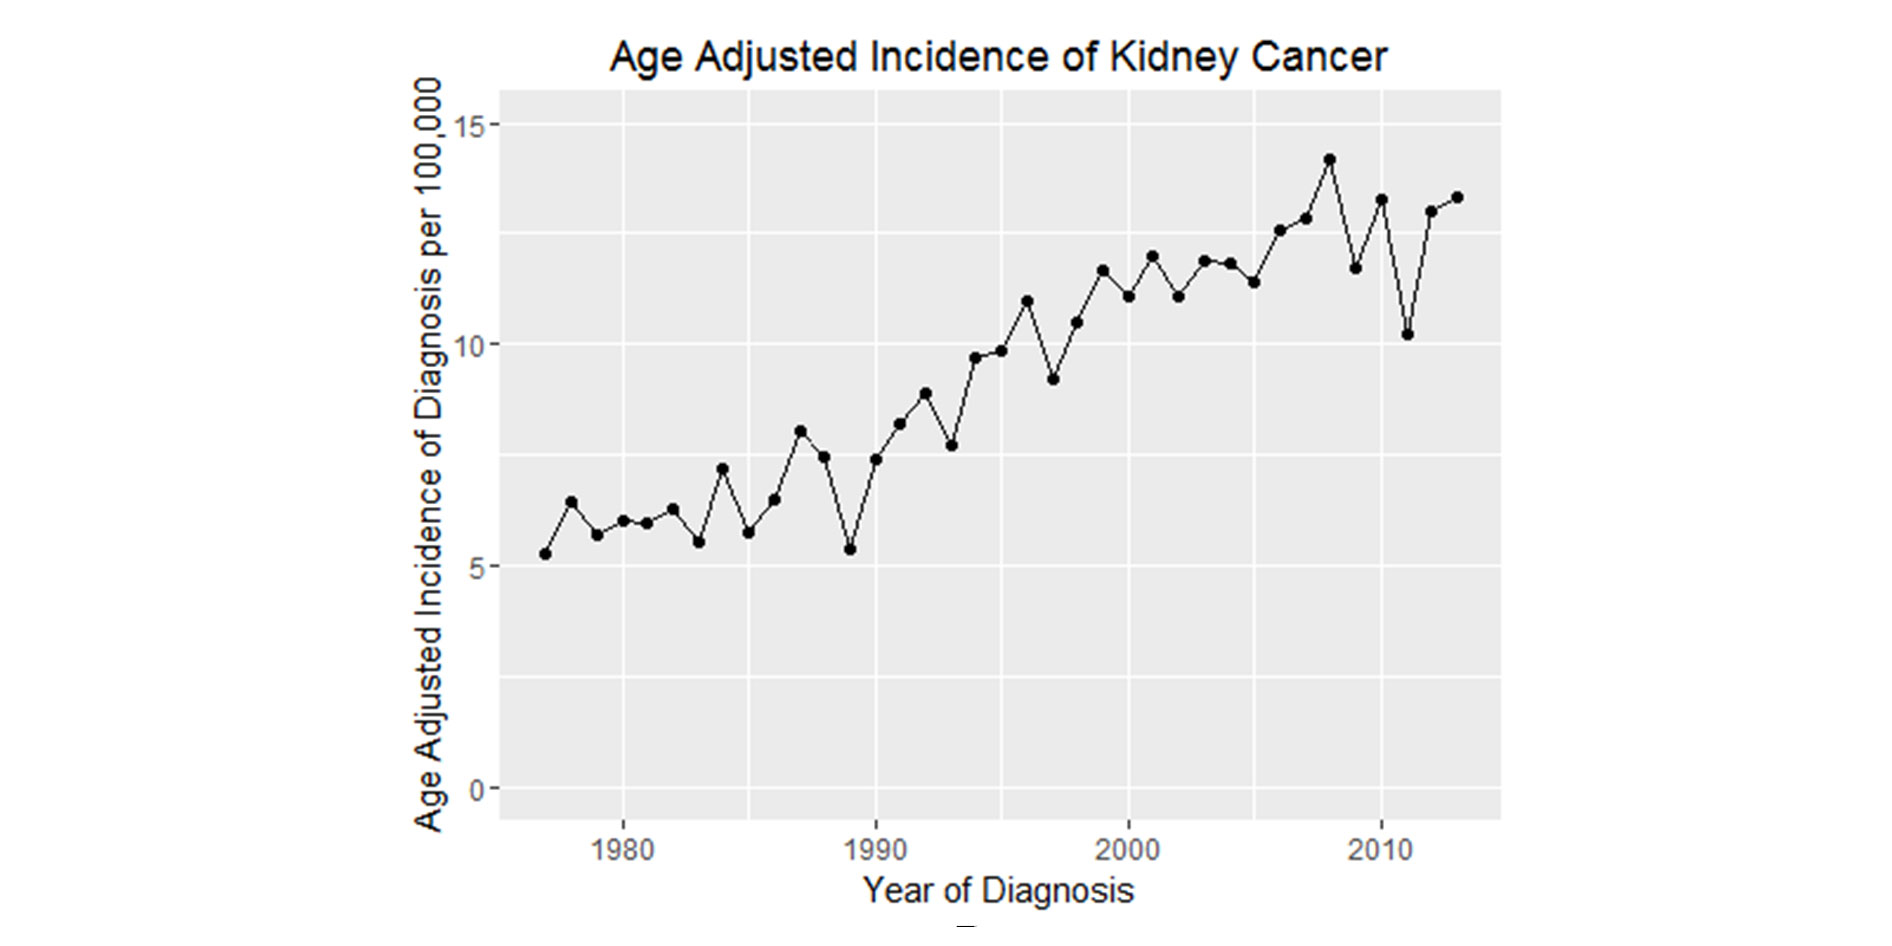 Figure 1. Age standardised incidence rates.
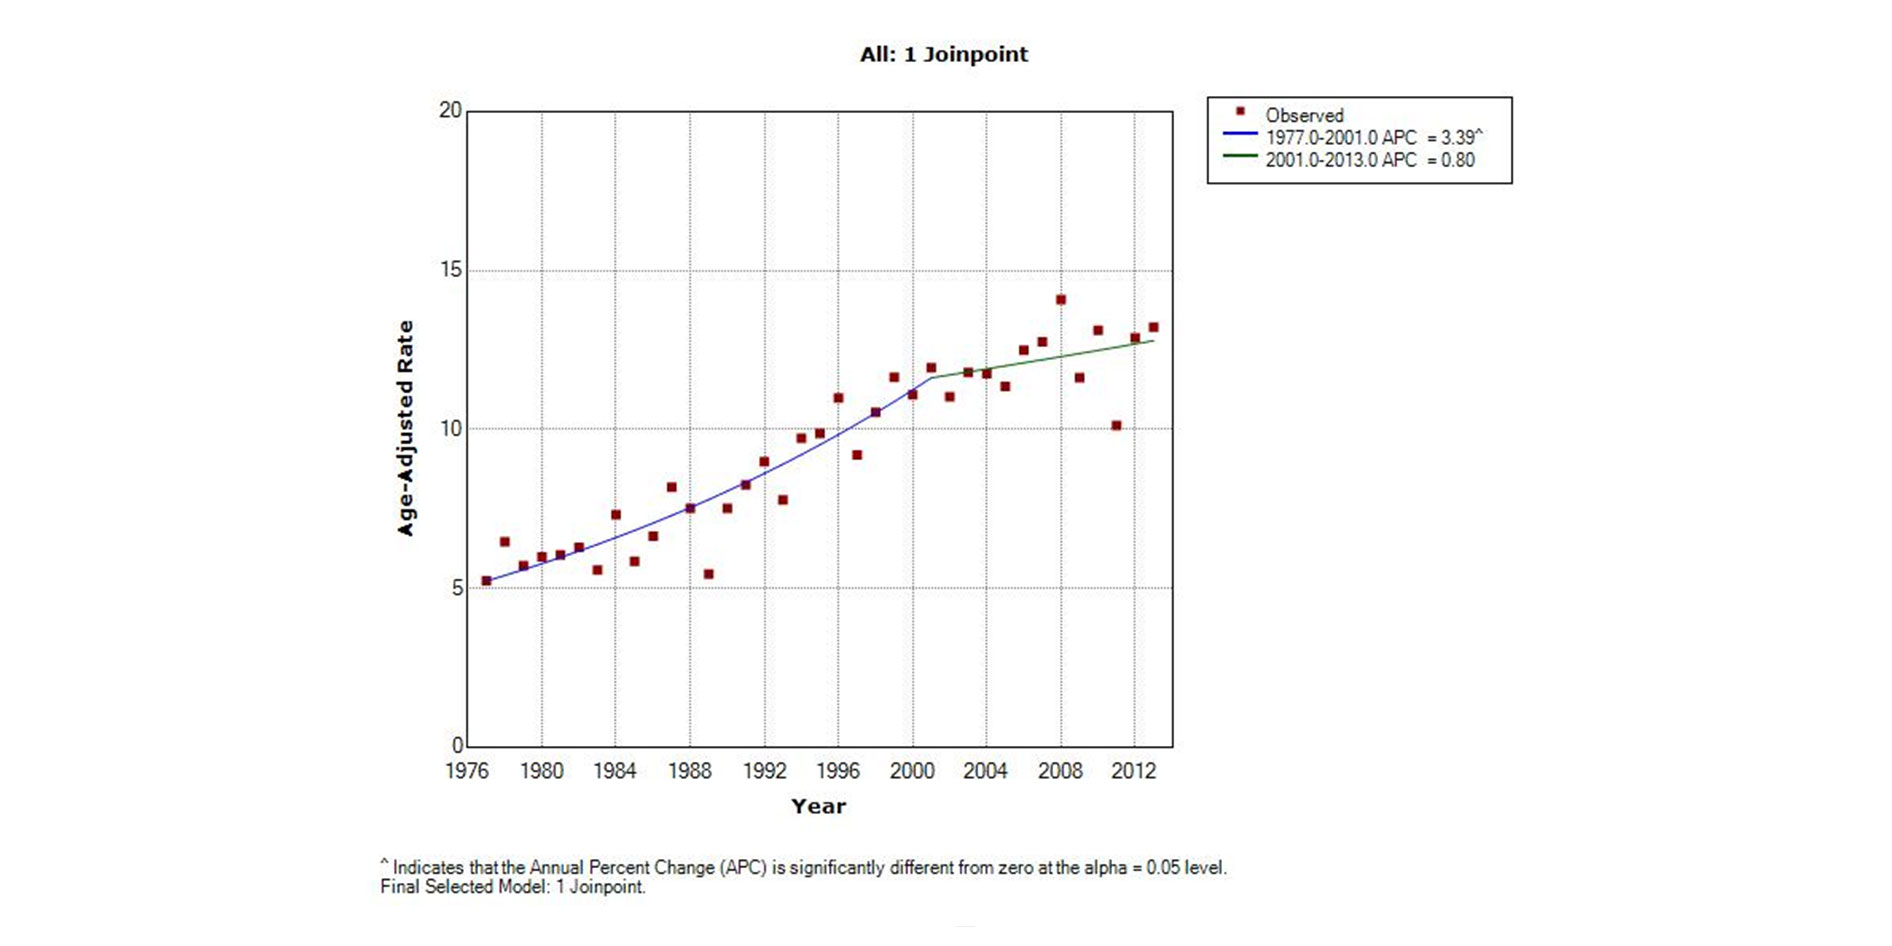 Figure 2. Jointpoint analysis.
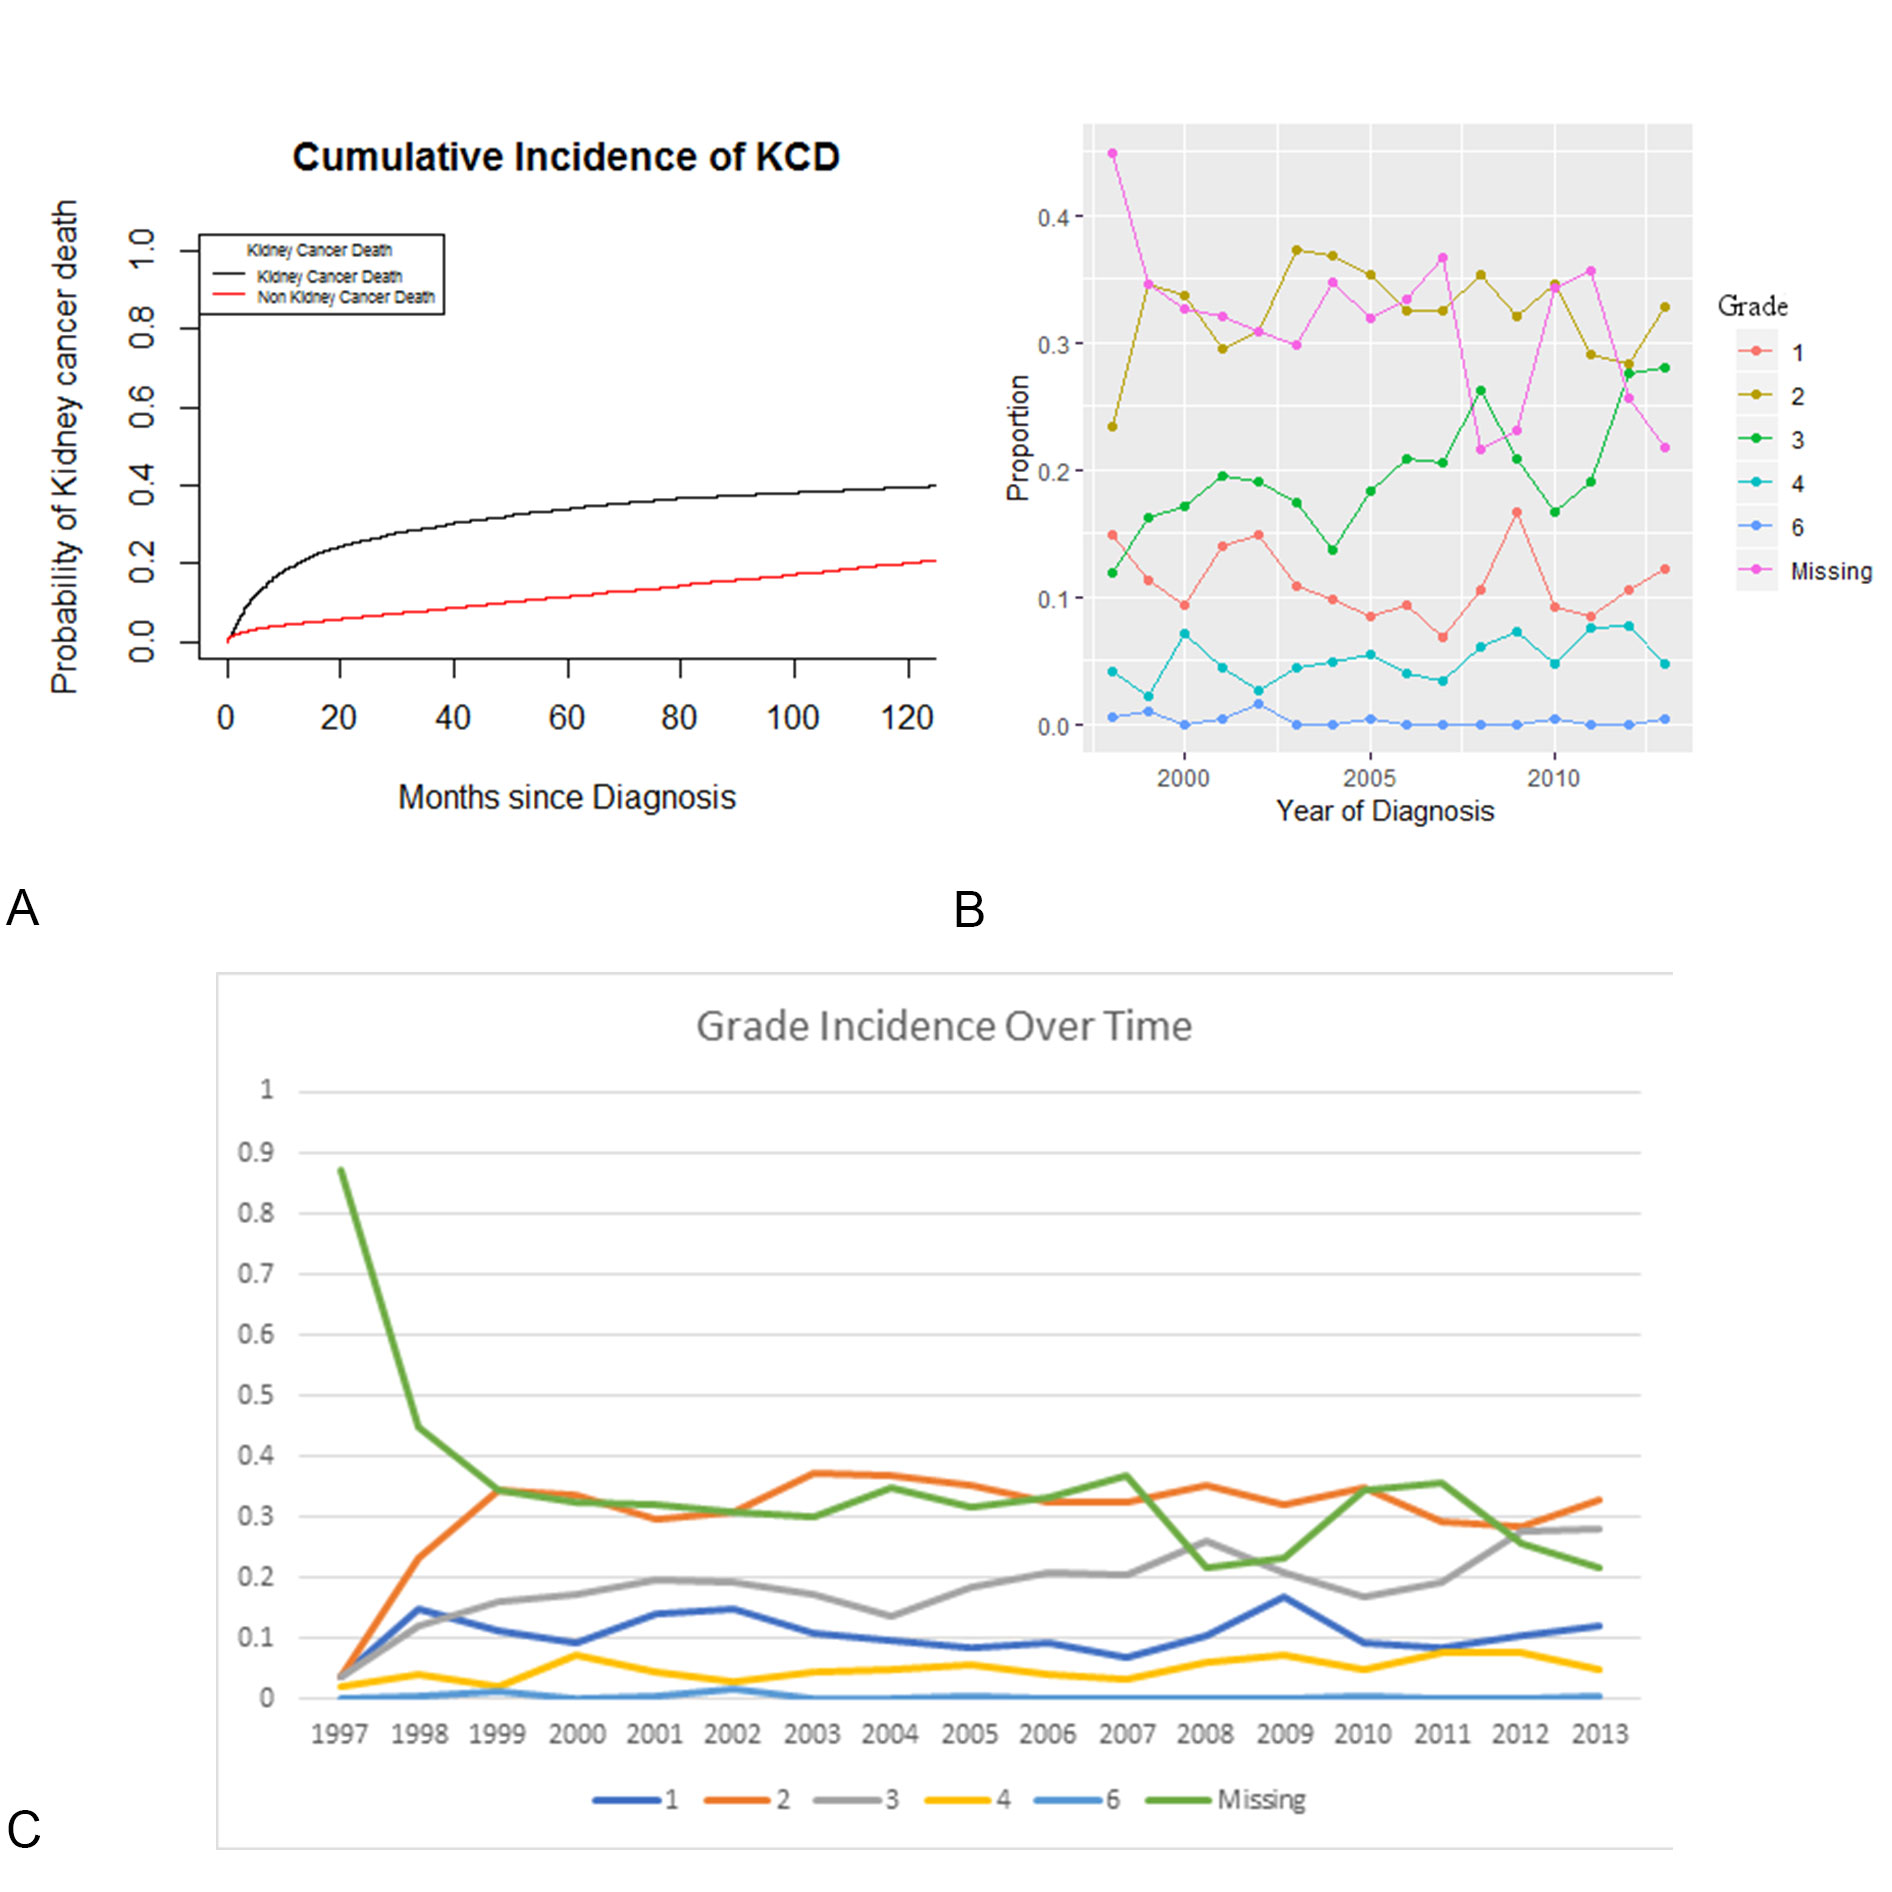 Figure 3. A. Cancer specific mortality; B. Survival according to grade; C. Grade incidence over time.
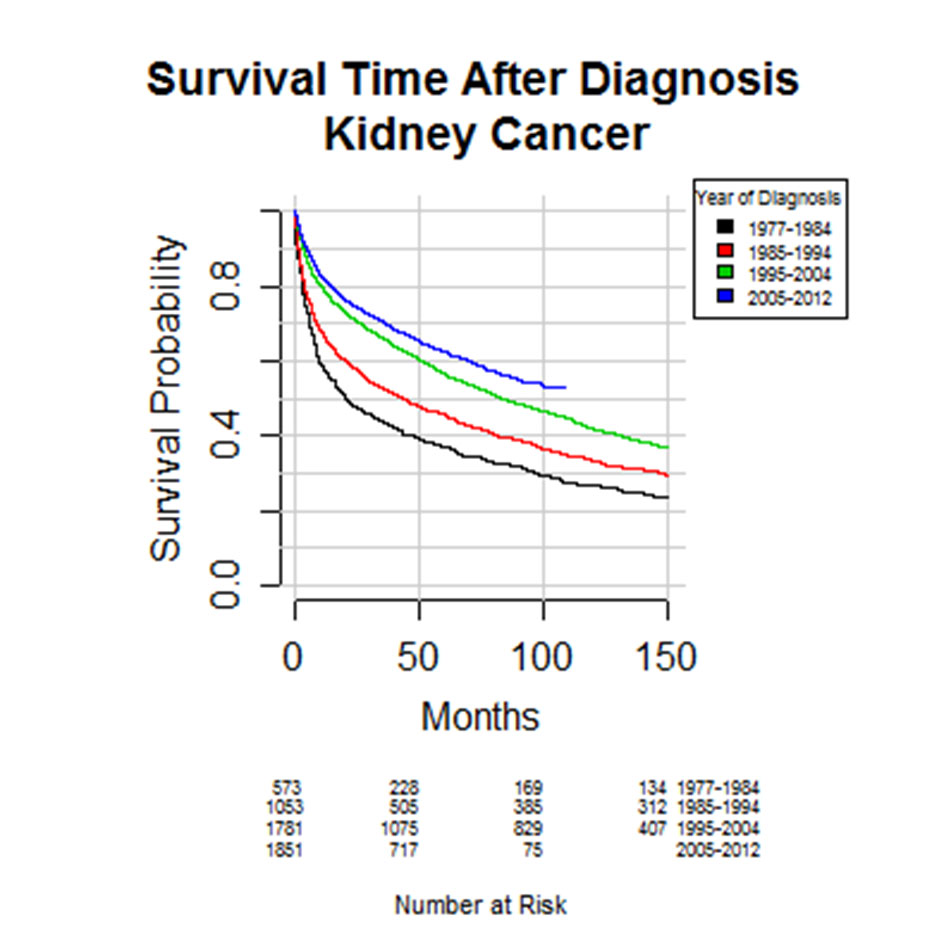
Figure 4. Overall survival by decade of diagnosis.
We found that within South Australia, when adjusting for population growth, the incidence of PKC has more than doubled since 1977. Whilst incidence is still increasing, since 2001 the rate at which it is increasing has plateaued. During the study period we observed an increase in incidence in the higher grades of PKC at diagnosis. Despite this, overall survival has improved at each decade of diagnosis.
According to the Australian Department of Health between 1982 and 2007, incidence of PKC increased from 6.2 to 12 new cases per 100,000 [10]. In the same report, 5 year survival from PKC increased from 47% in the period 1982 – 1987 to 72% in 2006 – 2010, with presented data also showing a step-wise improvement in CSS and OS. International trends in survival have been similar and are thought to be due to earlier detection rates [11].
Interestingly, there are mixed data within the literature regarding socio-economic status, with some researchers finding people in lower socio-economic groups having an increased incidence, [12] presenting with later stage tumours [13] and demonstrating a higher likelihood of metastatic disease at presentation [14] but other authors concluding that there is no association between socio-economic status and PKC incidence or mortality [15, 16]. Our findings support this later group with no association found between socio-economic status and PKC incidence or mortality.
Established risk factors for development of PKC include smoking, hypertension, environmental factors, genetic factors, male gender, and acquired cystic disease of the kidney. Consistent with established trends worldwide, we found the incidence of PKC greater in men and was seen to be associated with a worse prognosis [17, 18]. Examining the trends for these established risk declined in Australia during the study time, from 37% of the population in 1977, to 16.1% of the population in 2011-2012 [12]. The rates of dialysis, which is an indicator of acquired cystic disease of the kidney, itself is a risk factor for PKC, have increased over the past 30 years, from 0.016% of the population in 1987 to 0.050% in 2012 [19]. A similar trend is seen in overweight and obese individuals, with rates tripling in the past two decades, currently affecting 62.8% of Australian adults, with obesity rates higher in lower income adults and in non-metropolitan areas [20]. Conversely though, the prevalence of hypertension has been declining over the past 30 years [20]. Consequently, while some risk factors for PKC have increased at the population level, others have decreased, providing no clear causative explanation.
The increasing use of abdominal imaging has played a significant role in the increasing incidence of PKC, likely beyond any effect of changing risk and protective factors at the population level. In Rossi et al.’s meta-analysis of the role of abdominal ultrasonography in the detection of renal cancer, the rate of detection on incidental imaging (0.73%) was nearly three times that found when screening for PKC (0.25%). One potential explanation for the changing trends and the association with PKC detected incidentally is due to the increasing availability, access, and frequency of abdominal imaging. As evidence for this, between 1996 and 2011 there was a 50% increase in the use of CT scans within Australia [21]. This is likely to account for a significant proportion of the observed increasing incidence along with improved survival.
It is likely that the observed improvement in survival can be in part attributed to improved treatment of PKC and a greater understanding of its natural course. This includes more complex patients being offered definitive therapy with advances in peri-operative care and less invasive surgical techniques. Additional treatment options now include active surveillance, non-surgical options such as cryotherapy and radio-frequency ablation (RFA), as well as systemic therapies for advanced disease (although there are mixed data regarding their impact on survival). Consistent with international trends [22, 23], the treatment of localised PKC within Australia has shown a shift from radical nephrectomy to nephron-sparing surgery [24, 25], consistent with guideline recommendations from both the European Association of Urology and American Urological Association [26, 27]. Also observed over the same time period is an increase in the use of non-operative treatment strategies (active surveillance, RFA, cryotherapy), especially amongst the elderly or comorbid [22, 28].
Limitations
Data for this study came from the SA Cancer Registry which spanned over 40 years of data collection. It is likely that data from the early years was more variable in quality than data collected in more recent years. The main limitation is the lack of stage information at diagnosis. It is intuitive to think higher grade of PKC is associated with a higher stage. It is difficult to determine the whether the improved mortality observed is due to tumours being diagnosed at an earlier stage. Additionally, as this is registry data it was not possible to control for all potential confounding factors.
Lead time bias is one potential confounding factor. The impact of the discovery and treatment of cancers that may never have posed a threat to life (with the expected) improvement in CSS is one variable not assessed in registry studies. It is intuitive to think that patients with incidentally found cancers would have better cancer specific mortality; however, they may not have better overall survival as the reason for the initial scan may be due to investigation for other comorbidities. However, the improvement in mortality seen in both CSS and OS is likely multifactorial and the effect of lead time bias is difficult to distinguish.
Funding
None.
Ethics approval and consent to participate
This study did not require prior ethics approval or consent from human participants.
Author contributions
RH: draft of manuscript, revision, collation of information.
AK: assistance with the above.
MO: epidemiologist and statistician.
KDO: public health physician and director of prevention and public health, collation and interpretation of public health data.
DF: supervisor.
Competing interests
The authors declare no conflict of interest with the work.
-
Australian Institute of Health and Welfare: Australian Cancer Incidence and Mortality (ACIM) books: Kidney cancer. In. Epub ahead of print. Canberra.: AIHW; 2016.
-
Howlader N, Noone AM, Krapcho M: SEER Cancer Statistics Review, 1975–2010, National Cancer Institute. Epub ahead of print.( based on November 2012 SEER data submission, posted to the SEER web site, accessed Feb 2017).
-
Curado M, Edwards B, Shin H, Storm H, Ferlay J, Heanue M, Boyle P: Cancer Incidence in Five Continents. IARC Scientific Publications No 160 Lyon: IARC 2007 Epub ahead of print.
-
Chow WH, Linehan WM, Devesa SS: Re: Rising incidence of small renal masses: a need to reassess treatment effect. J Natl Cancer Inst 2007, 99(7):569-570; author reply 570-561.
-
Kendall BJ, Wilson LF, Olsen CM, Webb PM, Neale RE, Bain CJ, Whiteman DC: Cancers in Australia in 2010 attributable to overweight and obesity. Aust N Z J Public Health 2015, 39(5): 452-457.
-
Znaor A, Lortet-Tieulent J, Laversanne M, Jemal A, Bray F: International variations and trends in renal cell carcinoma incidence and mortality. Eur Urol 2015, 67(3): 519-530.
-
McCredie M, Stewart JH: Risk factors for kidney cancer in New South Wales. IV. Occupation. Br J Ind Med 1993, 50(4): 349-354.
-
Nalavenkata S, Jarvis TR, Rashid P: Incidental small renal mass: current management. ANZ Journal of Surgery 2011, 81(11): 797-803.
-
Lipworth L, Tarone RE, McLaughlin JK: The epidemiology of renal cell carcinoma. J Urol 2006, 176(6 Pt 1): 2353-2358.
-
Cancer survival and prevalence in Australia: period estimates from 1982 to 2010. Asia Pac J Clin Oncol 2013, 9(1): 29-39.
-
Sun M, Abdollah F, Bianchi M, Trinh QD, Jeldres C, Tian Z, Shariat SF, Widmer H, Zorn K, Menon M et al: A stage-for-stage and grade-for-grade analysis of cancer-specific mortality rates in renal cell carcinoma according to age: a competing-risks regression analysis. Eur Urol 2011, 60(6): 1152-1159.
-
Mellemgaard A, Engholm G, McLaughlin JK, Olsen JH: Risk factors for renal cell carcinoma in Denmark. I. Role of socioeconomic status, tobacco use, beverages, and family history. Cancer Causes Control 1994, 5(2): 105-113.
-
Halpern MT, Ward EM, Pavluck AL, Schrag NM, Bian J, Chen AY: Association of insurance status and ethnicity with cancer stage at diagnosis for 12 cancer sites: a retrospective analysis. Lancet Oncol 2008, 9(3): 222-231.
-
Klaassen Z, DiBianco JM, Jen RP, Reinstatler L, Evans AJ, Li Q, Madi R, Terris MK: Mp5-09 Clear Cell Renal Cell Carcinoma: Socioeconomic Predictors Of Metastatic Disease At Diagnosis. The Journal of Urology 2015, 193(4): e48.
-
Hellenthal NJ, Bermejo CE: The role of socioeconomic status in renal cell carcinoma. Urol Oncol 2012, 30(1): 89-94.
-
Ward EM, Fedewa SA, Cokkinides V, Virgo K: The association of insurance and stage at diagnosis among patients aged 55 to 74 years in the national cancer database. Cancer J 2010, 16(6): 614-621.
-
Capitanio U, Bensalah K, Bex A, Boorjian SA, Bray F, Coleman J, Gore JL, Sun M, Wood C, Russo P: Epidemiology of Renal Cell Carcinoma. Eur Urol 2019, 75(1): 74-84.
-
Woldrich JM, Mallin K, Ritchey J, Carroll PR, Kane CJ: Sex differences in renal cell cancer presentation and survival: an analysis of the National Cancer Database, 1993-2004. J Urol 2008, 179(5):1709-1713; discussion 1713.
-
Registry A: ANZDATA Annual Reports. In. Epub ahead of print. Adelaide, Australia: Australia and New Zealand Dialysis and Transplant Registry; 2016.
-
Nichols M, Peterson K, Herbert J, Allender S: Australian heart disease statistics. Overweight, obesity, and cardiovascular disease - past, present and future.Epub ahead of print. Melbounre: National Heart Foundation of Australia; 2015.
-
Gibson DA, Moorin RE, Semmens J, Holman DJ: The disproportionate risk burden of CT scanning on females and younger adults in Australia: a retrospective cohort study. Aust N Z J Public Health 2014, 38(5): 441-448.
-
Tan HJ, Filson CP, Litwin MS: Contemporary, age-based trends in the incidence and management of patients with early-stage kidney cancer. Urol Oncol 2015, 33(1): 21.e19-21.e26.
-
Jabaji RB, Fischer H, Kern T, Chien GW: Trend of Surgical Treatment of Localized Renal Cell Carcinoma. Perm J 2019, 23: 18-108.
-
Patel MI, Strahan S, Bang A, Vass J, Smith DP: Predictors of surgical approach for the management of renal cell carcinoma: a population-based study from New South Wales. ANZ J Surg 2017, 87(11): E193-e198.
-
White V, Marco DJT, Bolton D, Davis ID, Jefford M, Hill D, Prince HM, Millar JL, Winship IM, Coory M et al: Trends in the surgical management of stage 1 renal cell carcinoma: findings from a population-based study. BJU Int 2017, 120 Suppl 3: 6-14.
-
Ljungberg B, Albiges L, Bensalah K, Bex A, Giles RH, Hora M, Kuczyk MA, Lam T, Marconi L, Merseburger AS et al: EAU Guidelines on Renal Cell Carcinoma 2018. In: European Association of Urology Guidelines 2018 Edition. Volume presented at the EAU Annual Congress Copenhagen 2018, edn. Arnhem, The Netherlands: European Association of Urology Guidelines Office; 2018.
-
Campbell S, Uzzo RG, Allaf ME, Bass EB, Cadeddu JA, Chang A, Clark PE, Pierorazio PM, Davis BJ, Derweesh IH et al: Renal Mass and Localized Renal Cancer: AUA Guideline. In: American Urological Association Guidelines 2017. Epub ahead of print., edn. Maryland, USA: American Urological Association; 2017.
-
Ta AD, Bolton DM, Dimech MK, White V, Davis ID, Coory M, Millar J, Giles G: Contemporary management of renal cell carcinoma (RCC) in Victoria: implications for longer term outcomes and costs. BJU Int 2013, 112 Suppl 2: 36-43.
Annals of urologic oncology
p-ISSN: 2617-7765, e-ISSN: 2617-7773
 Copyright © Ann Urol Oncol. This work is licensed under a Creative Commons Attribution-NonCommercial-No Derivatives 4.0 International (CC BY-NC-ND 4.0) License.